
- Home >
- Stock Photos >
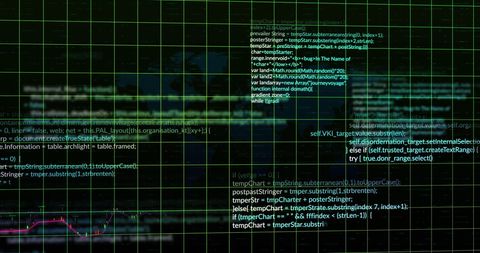
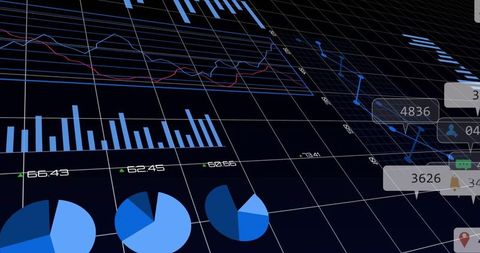
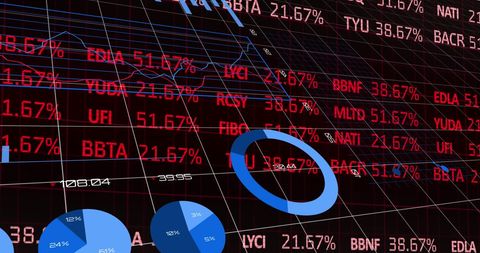
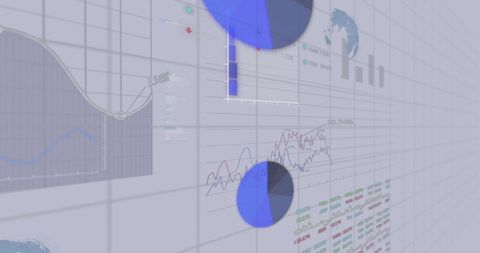
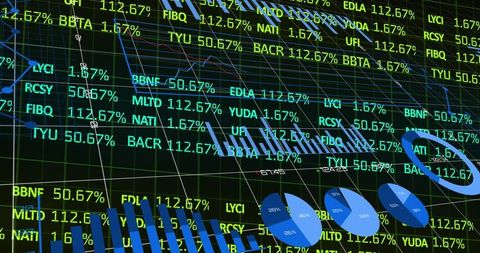
- Digital Dashboard with Computer Code and Financial Graphs
Digital Dashboard with Computer Code and Financial Graphs Image
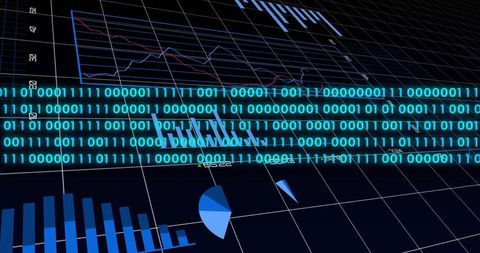
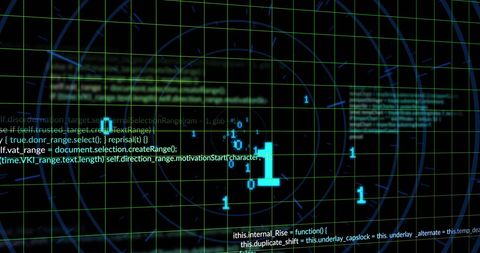
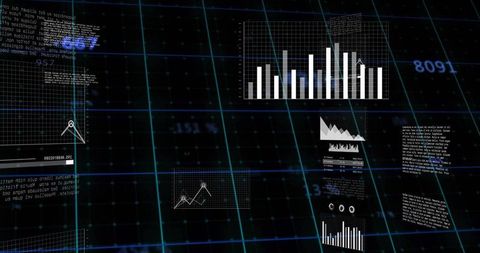
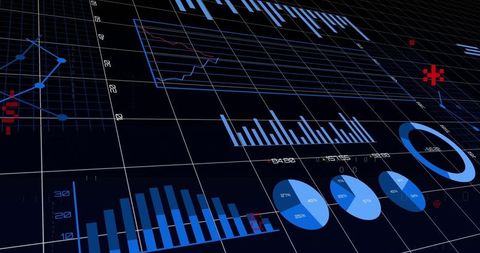
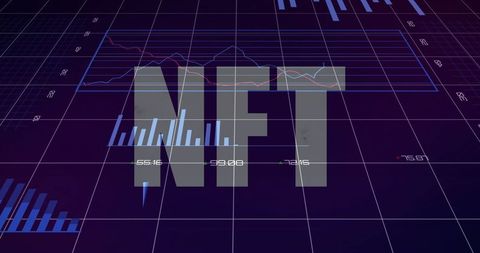
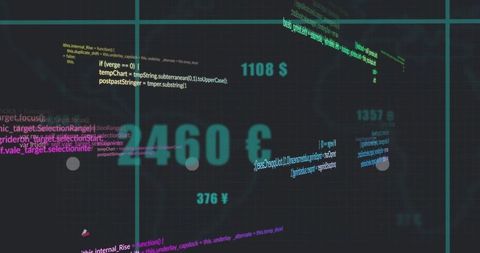
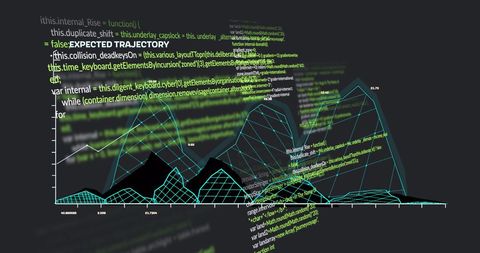
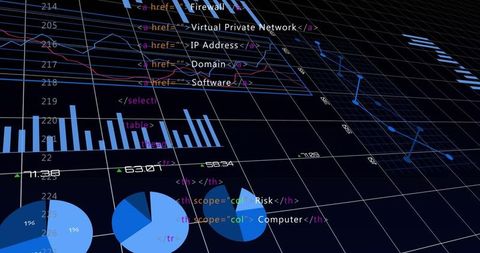
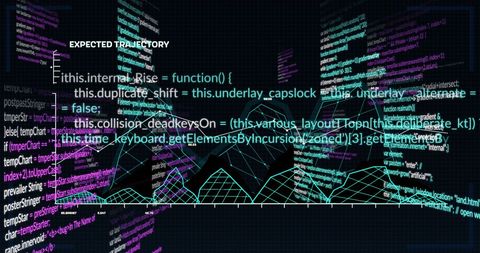
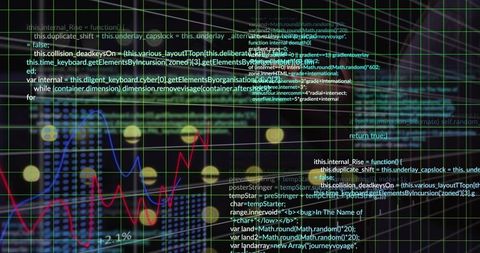
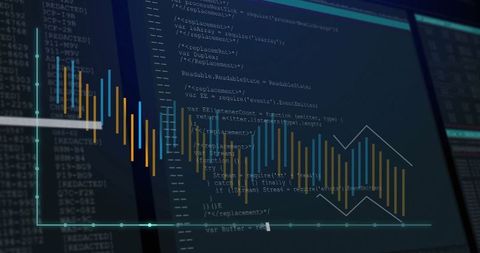
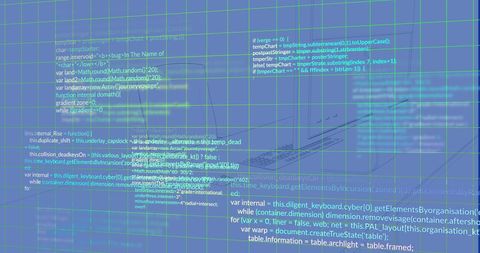
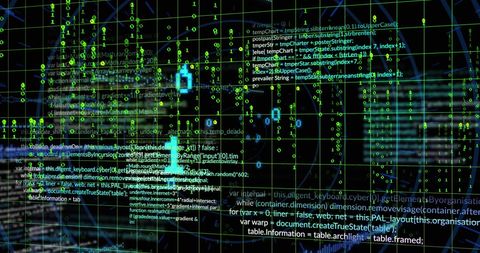
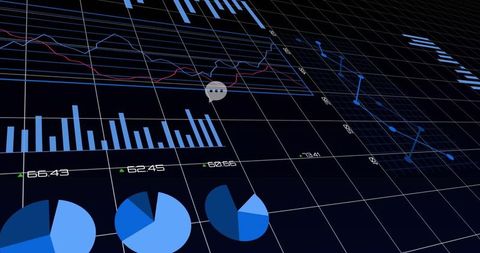
Visualization combines glowing binary code overlay with various financial graphs such as line, pie, and bar charts. Great for illustrating futuristic data analysis, digital transformation, or technology-driven financial innovations. Useful in presentations on analytics technologies, business intelligence software, or cyber security measures related to digital data handling.
Powered by 


downloads
Tags:
More
Credit Photo
If you would like to credit the Photo, here are some ways you can do so
Text Link
photo Link
<span class="text-link">
<span>
<a target="_blank" href=https://pikwizard.com/photo/digital-dashboard-with-computer-code-and-financial-graphs/9812fdca1975327df4d3304fd56881b2/>PikWizard</a>
</span>
</span>
<span class="image-link">
<span
style="margin: 0 0 20px 0; display: inline-block; vertical-align: middle; width: 100%;"
>
<a
target="_blank"
href="https://pikwizard.com/photo/digital-dashboard-with-computer-code-and-financial-graphs/9812fdca1975327df4d3304fd56881b2/"
style="text-decoration: none; font-size: 10px; margin: 0;"
>
<img src="https://pikwizard.com/pw/medium/9812fdca1975327df4d3304fd56881b2.jpg" style="margin: 0; width: 100%;" alt="" />
<p style="font-size: 12px; margin: 0;">PikWizard</p>
</a>
</span>
</span>
Free (free of charge)
Free for personal and commercial use.
Author: People Creations
Similar Free Stock Images

Premium


Premium


Premium


Premium


Premium


Premium


Premium


Premium

Premium

Premium

Premium


Premium

Premium


Premium


Premium

Premium


Premium


Premium


Premium

Premium


Premium


Premium


Premium


Premium


Premium


Explore More Free Stock Images