- Home >
- Stock Photos >
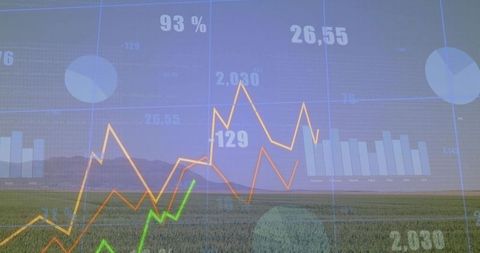
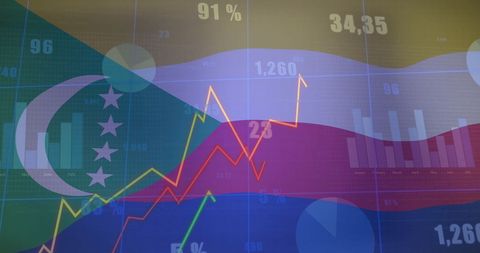
- Digital Dashboard with Data Analytics and Visualization
Digital Dashboard with Data Analytics and Visualization Image

This visual of a digital dashboard includes various elements of data analytics such as line graphs, bar charts, and pie charts embedded with numeric labels. Perfect for illustrating concepts of business intelligence, performance metrics, and their visualizations in presentations, reports, or online content related to data analysis and strategic planning.

downloads
Tags:
More
Credit Photo
If you would like to credit the Photo, here are some ways you can do so
Text Link
photo Link
<span class="text-link">
<span>
<a target="_blank" href=https://pikwizard.com/photo/digital-dashboard-with-data-analytics-and-visualization/9a43c48b8679e3025747cd79aeb68afe/>PikWizard</a>
</span>
</span>
<span class="image-link">
<span
style="margin: 0 0 20px 0; display: inline-block; vertical-align: middle; width: 100%;"
>
<a
target="_blank"
href="https://pikwizard.com/photo/digital-dashboard-with-data-analytics-and-visualization/9a43c48b8679e3025747cd79aeb68afe/"
style="text-decoration: none; font-size: 10px; margin: 0;"
>
<img src="https://pikwizard.com/pw/medium/9a43c48b8679e3025747cd79aeb68afe.jpg" style="margin: 0; width: 100%;" alt="" />
<p style="font-size: 12px; margin: 0;">PikWizard</p>
</a>
</span>
</span>
Free (free of charge)
Free for personal and commercial use.
Author: Authentic Images