
- Home >
- Stock Photos >
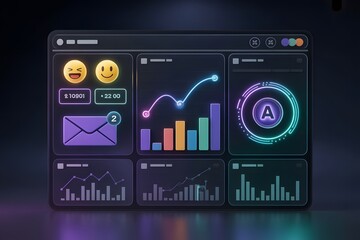
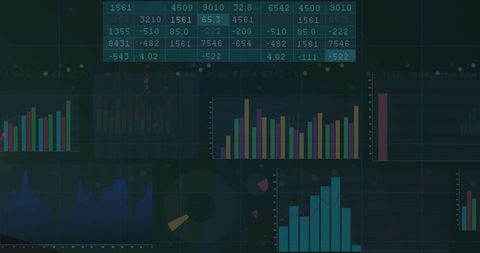
- Digital Dashboard with Data Trends and Chat Technology Elements
Digital Dashboard with Data Trends and Chat Technology Elements Image

Image showcases digital interface featuring graphs and chat bubbles. Especially useful for presentations on data analysis, online communication systems, or technological interfaces. Ideal for illustrating the integration of real-time data discussion tools within tech platforms.
Powered by 


downloads
Tags:
More
Credit Photo
If you would like to credit the Photo, here are some ways you can do so
Text Link
photo Link
<span class="text-link">
<span>
<a target="_blank" href=https://pikwizard.com/photo/digital-dashboard-with-data-trends-and-chat-technology-elements/5103b50cb35dbaeea302dabc380f67a3/>PikWizard</a>
</span>
</span>
<span class="image-link">
<span
style="margin: 0 0 20px 0; display: inline-block; vertical-align: middle; width: 100%;"
>
<a
target="_blank"
href="https://pikwizard.com/photo/digital-dashboard-with-data-trends-and-chat-technology-elements/5103b50cb35dbaeea302dabc380f67a3/"
style="text-decoration: none; font-size: 10px; margin: 0;"
>
<img src="https://pikwizard.com/pw/medium/5103b50cb35dbaeea302dabc380f67a3.jpg" style="margin: 0; width: 100%;" alt="" />
<p style="font-size: 12px; margin: 0;">PikWizard</p>
</a>
</span>
</span>
Free (free of charge)
Free for personal and commercial use.
Author: Authentic Images
Similar Free Stock Images

Premium


Premium


Premium


Premium


Premium


Premium


Premium


Premium

Premium

Premium


Premium

Premium


Premium


Premium


Premium


Premium


Premium


Premium


Premium


Premium


Premium


Premium


Premium
Premium


Premium


Explore More Free Stock Images