1. Home > 
  2. Stock Photos > 
  3. Digital Dashboard with Data Visualization and Social Engagement

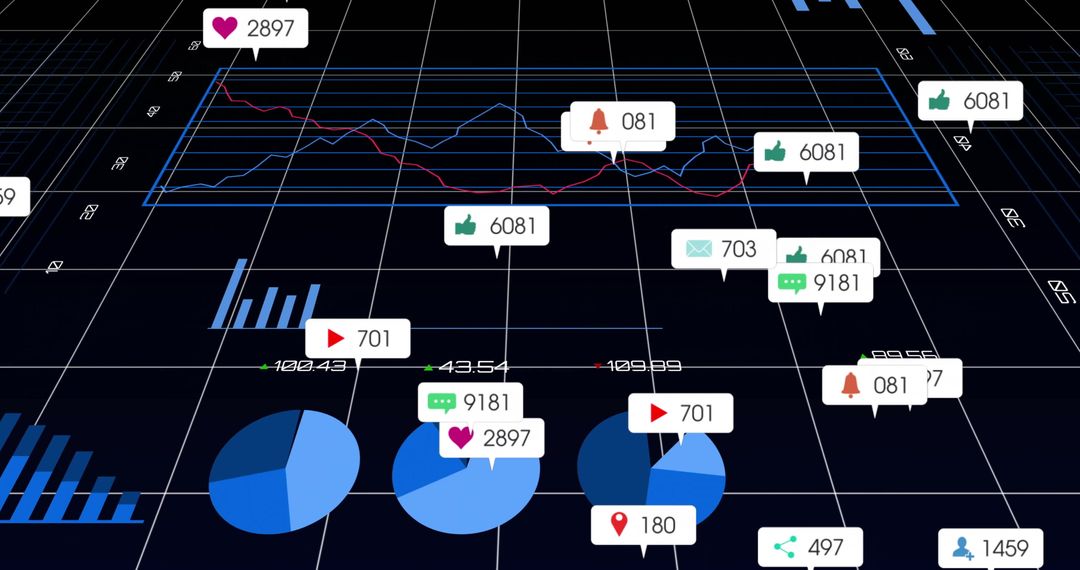
Digital Dashboard with Data Visualization and Social Engagement Image

Digital Dashboard with Data Visualization and Social Engagement

A sophisticated digital dashboard displaying analytics through purple grid-based line charts and overlaid social engagement icons, showcasing interactions such as likes and comments. Ideal for use in presentations and articles focused on data analytics, technology interfaces, interactive displays, and business intelligence solutions. Highlights the intersection of technology and social media engagement within digital analytics platforms.

Powered by Shutterstock logo - Get 15% off with code: PIKWIZARD15
Businessman analyze and visualize complex information on a virtual screen using AI to process data. Big data technology and data science.Data flow.Digital neural network.artificial intelligence - Powered by Shutterstock - Get 15% off with code: PIKWIZARD15Professional Using AI-Powered Laptop and Smartphone to Analyze Data Insights and Marketing Analytics with Holographic Graphs and Infographics, Showcasing Advanced Technology and Future Digital - Powered by Shutterstock - Get 15% off with code: PIKWIZARD15Analyst working with Business, Concept digital transformation technology strategy, Analytics and Data Management System on computer, make a report with KPI and metrics connected to database. - Powered by Shutterstock - Get 15% off with code: PIKWIZARD15Man look at the dashboard with graphs and charts. Concept of data management system, business intelligence, data statistics, marketing analysis, key performance indicators (KPI) and analytics. - Powered by Shutterstock - Get 15% off with code: PIKWIZARD15Businessman using laptop computer analyzing sales data and financial growth graph chart report. Business planning, strategy and development. Financial accounting. market research, data analysis - Powered by Shutterstock - Get 15% off with code: PIKWIZARD15

Credit Photo

If you would like to credit the Photo, here are some ways you can do so

Free (free of charge)

Free for personal and commercial use.

Author: People Creations

Similar Free Stock Images

Dynamic Financial Data and Graph Arrows in Digital Interface
Premium
Analyst working with Business Analytics and Data Management System on computer to make report with KPI and metrics connected to database. Corporate strategy for finance, operations, sales, marketing
Abstract Representation of Stock Market Data Overlaying Urban Landscape
Stock Market Data Overlaid on Foggy Cityscape
Financial Data Overlay on Night Cityscape Reflecting Global Market Activity
Digital Finance Analytics Interface with Transparent Cityscape Background
Premium
Hand holding smartphone displays data visualizations, including histogram and pie chart. Analytics, digital transformation and increasing use of mobile technology in business. Minimalist art collage.
Financial Data Processing Overlaid on Office Background
Financial Data Visualization with Global Connections
Digital Data Processing with Graphical Interfaces on Blue Background
Financial Data Processing with Digital Interface Display
Premium
Data analytics and insights powered by big data and AI technologies. Data scientist analysing complex information with artificial intelligence for business analytics dashboard with charts and metrics.
Digital Interface for Data Processing and Global Business Concepts
Financial Data Overlay on Landfill With Industrial Context
Digital Data Flow and Code on Blue Tech Background
Technological Data Analysis with Global Digital Interface
Premium
Business Analytics and Data Management System (DMS) giving key insights for corporate strategy. Concept with expert analyst building visualization with KPI and metrics from database information
Futuristic Interface with Graphs Displayed on Transparent Screen
Futuristic HUD with Data Visualization Over Coastal Landscape
Futuristic Digital Connectivity Across Africa Planetary View
Abstract Financial and Cybersecurity Data Dashboard Overlay
Premium
Displaying bar chart on wood backdrop, showing teal and orange bars, €¥£¢ labels, two line graphs. Data visualization, analytics, digital dashboard, finance, charts, sustainability, modern
Futuristic Holographic Data Interface with Analytics Visualization
World Map with Social Media Analytics Dashboard Data Visualization
3D Graphs with Social Media Icons and Analytics Overlays
Futuristic Digital Data Dashboard with Analytics and Graph Icons
Premium
Featuring blue ring chart pulsing in virtual dashboard over 3D grid, with bar charts, line graphs. Data visualization, analytics, digital interface, futuristic, financial data, infographic, interface
World Map with Data Visualization Overlay
Digital Engagement and Analytics Visualization with Thumbs Up Icons
Interactive Analytics with Digital Social Media Elements Overlay
Dynamic Financial Charts and Stock Market Analytics Display
Digital Analytics Interface Over Cityscape at Dusk
Digital Financial Data Overlay on Urban Cityscape Concept
Premium
Dashboard finance management on laptop computer analyzing sales data and growth graph chart report. Business planning, strategy and development. Financial accounting. market research, data analysis
Wind Turbines Against Financial Graph Skyscraper Environment
Digital Data Overlay on Financial District Skyline
Sustainable Icons Overlay on Financial Data Analysis Concept
Global Financial Data and Analytics Visualization Concept
Premium
Professional data analyst using data visualizations dashboard on computer monitor for data business analysis and Data Management System
Futuristic Data Interface with Network Connections and Analytics
Digital Network with Data Processing Concept
Social Media Engagement Overlay on Urban Cityscape
Digital Landscape with Data Processing Over Cityscape
Premium
Man look at the dashboard with graphs and charts. Concept of data management system, business intelligence, data statistics, marketing analysis, key performance indicators (KPI) and analytics.
Futuristic World Map with 3D Data Overlays and Floating Tickers
Digital Interface with Data Processing and Global Business Concept
Digital Data Processing and Analytics in Modern Business Innovation
Hybrid View of Financial Graphics Over Modern Cityscape
Premium
Data analytics and insights powered by AI and big data technologies. Businessman analyzing binary complex information with artificial intelligence for business analytics dashboard charts and metrics.
Futuristic Financial Data Over Urban Waterfront at Night
Night Highway with Digital Financial Overlay Charts
Futuristic Holographic Financial Data Interface Background
Digital Dashboard Showing Cryptocurrency Trading with Social Alerts
Premium
Analysts use computers to analyze statistical data to improve targeted digital online marketing strategies for a business advantage. Data Science Software Developer.
Futuristic Data Analytics Display with Interactive Graphs and Charts
Futuristic Stock Market Chart and Data Interface
Digital Financial Dashboard with Growth Indicators and Analytics
Financial Data Overlap with Scenic Coastal View
Premium
Woman looking at website traffic analytics data on computer
Abstract Matrix of Encrypted File Systems in Cybersecurity Environment
Futuristic Digital Analytics Visualization with Numerical Data Points
Futuristic Cybersecurity Interface with Financial Data Analytics
Financial Data Processing Over Modern Cityscape Double Exposure
Digital Financial Data Overlaying Cityscape Illustration
Digital Stock Market Dashboard Over Cityscape
Premium
KPI data analytics concept, Key performance indicator analysis system. Information technology digital software management. Visualization tech solution. Business artificial intelligence. AI dashboard.
Digital Financial Data with Business Charts Revealing Economic Trends
Digital Financial Data Interface Over Urban Skyline
Financial Data Processing Across Cityscape Interface
Analyzing Financial Data with Digital Graphs on Transparent Screens
Premium
Businessman pointing chart financial goals and economic business planning global.
Digital Interface Displaying Changing Financial Symbols and Metrics
Cybersecurity Interface with Globe and Data Encryption Symbols
Digital Interface Displaying Global Financial and Business Data
Futuristic Big Data Analytics on Abstract Digital Background
Premium
Professional data analyst using data visualizations dashboard on computer monitor for data business analysis and Data Management System
Stock Market Data Overlay with Cloudy Sky Background
Financial Data Integration with Renewable Energy Technology
Global Finance Data with Blue World Map and Economic Metrics
Oil Pumpjack with Stock Market Data Reflecting Energy Sector Trends
Premium
A high-tech environment featuring a hand interacting with a futuristic transparent touchscreen display, showcasing data analytics and digital visuals for business insights.
Dynamic Financial Dashboard with Rising Chart and Analytics
Wind Turbines on Mountain with Financial Data Overlay
Professional Engaging Digital Data Analytics on Transparent Display
Futuristic 3D Data Visualization with Binary Code and Graphs
Premium
Displaying bar chart clusters line-graph overlays in dashboard over purple clouds, with data table. Futuristic, data, visualization, analytics, digital, dashboard, interface
Futuristic Digital Analytics Visualization with Binary Streams and Charts
Futuristic Data Visualization with Map and Code Interface
Wind Turbines in Digital Landscape Highlighting Renewable Energy and Data Innovation
Holographic World Map with Futuristic Digital Interface
Premium
Showing dashboard plotting line and bar charts on blue grid, with world map and numeric overlays. Analytics, visualization, data, technology, finance, dashboards, growth
Upward Trending Arrow on Virtual Financial Dashboard Background
Analytical Dashboard with Social Media Metrics and Line Charts
Financial Data Displayed Over Modern Cityscape
Global Business Analytics with Digital Data Visualization
Financial Data Processing Overlaying City Skyline
Futuristic Financial Data Interface Over Cityscape Backdrop
Premium
A hand interacts with glowing holographic data graphs and charts, showcasing futuristic digital visualization on a dark background. Concept of innovation
Digital Financial Dashboard with Cityscape Background
Dynamic Financial Data Analysis with Arrows
Financial Data Overlay with Social Media Metrics
Financial Data Charts Overlaying Modern Cityscape
Premium
Futuristic Digital Growth Chart – 3D Bar Graph with Glowing Blue Data Visualization
Futuristic Digital Interface Featuring Data and Global Network
Game Controller Icon over Complex Data Analytics Interface
Digital Graphs and Wind Turbines Illustrating Renewable Energy
Futuristic World Map Interface with Data Visualization
Premium
Digital approval and task management with futuristic interface. Businessman using stylus on tablet to complete checklist, analyze data on smart dashboard. Concept of workflow automation, e-signature.
Global Network and Technology Concept with Digital World Map
Global Data Interface Projecting Business Trends Worldwide
Interactive Dashboard with Analytics and Charts
Futuristic Global Network Visualization on Digital Interface
Premium
A businessman uses a laptop to access an AI-powered business analytics dashboard, showcasing charts, metrics, and KPIs. He analyzes performance data to generate. Data analysis concept.
Holographic Financial Data Display with Charts and Graphs
Global Financial Analysis Dashboard with Digital Interface
Futuristic Dashboard with 3D Earth Globe and Data Analytics
Interactive Dashboard with Stock Candlestick Chart and Social Engagement
Premium
Showing bar and line chart overlaying purple-lit grass, with yellow bars, red bars, white line. Data visualization, analytics, digital dashboard, charting, infographic, technology, modern
Futuristic Financial Data Visualization with Numeric Tags and Binary Code
Wind Turbines Amidst Financial Data Charts Illustrating Sustainable Growth
Futuristic Data Visualization with Analytics Graphics and Gold Stars
Financial Market Data Visualization with Line Graphs and Currency Symbols
Premium
Displaying financial chart with jagged red line 50.03 label on monitor, with blue and purple arrows. Finance, data visualization, analytics, digital dashboard, stock market, investment, technology
Transparent Stock Market Charts Over Urban Skyline with Cranes