- Home >
- Stock Photos >
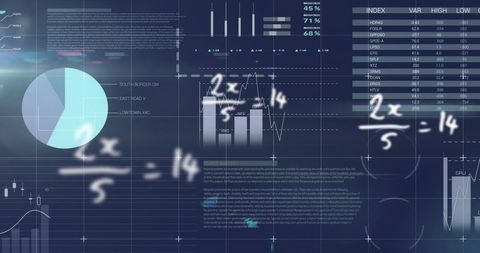
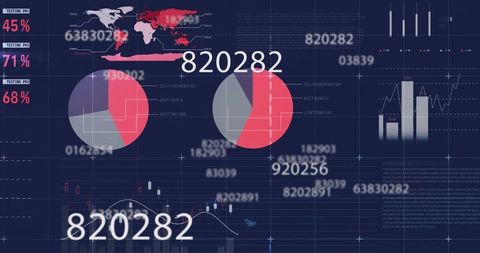
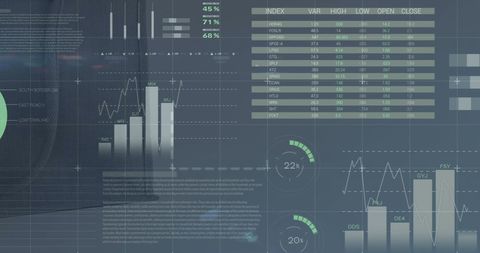
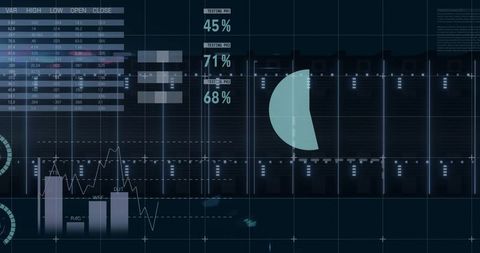
- Digital Dashboard with Financial Graphs and Data Analysis
Digital Dashboard with Financial Graphs and Data Analysis Image

Visual includes financial data visuals such as graphs and pie chart on black background, ideal for presentations on business analytics, data visualization, financial technology solutions, economic report set-ups, or enhancing websites dealing with technological analytics software systems.

downloads
Tags:
More
Credit Photo
If you would like to credit the Photo, here are some ways you can do so
Text Link
photo Link
<span class="text-link">
<span>
<a target="_blank" href=https://pikwizard.com/photo/digital-dashboard-with-financial-graphs-and-data-analysis/cfa25b19cdfc73f7bc18d6b28dc92842/>PikWizard</a>
</span>
</span>
<span class="image-link">
<span
style="margin: 0 0 20px 0; display: inline-block; vertical-align: middle; width: 100%;"
>
<a
target="_blank"
href="https://pikwizard.com/photo/digital-dashboard-with-financial-graphs-and-data-analysis/cfa25b19cdfc73f7bc18d6b28dc92842/"
style="text-decoration: none; font-size: 10px; margin: 0;"
>
<img src="https://pikwizard.com/pw/medium/cfa25b19cdfc73f7bc18d6b28dc92842.jpg" style="margin: 0; width: 100%;" alt="" />
<p style="font-size: 12px; margin: 0;">PikWizard</p>
</a>
</span>
</span>
Free (free of charge)
Free for personal and commercial use.
Author: Creative Art