
- Home >
- Stock Photos >
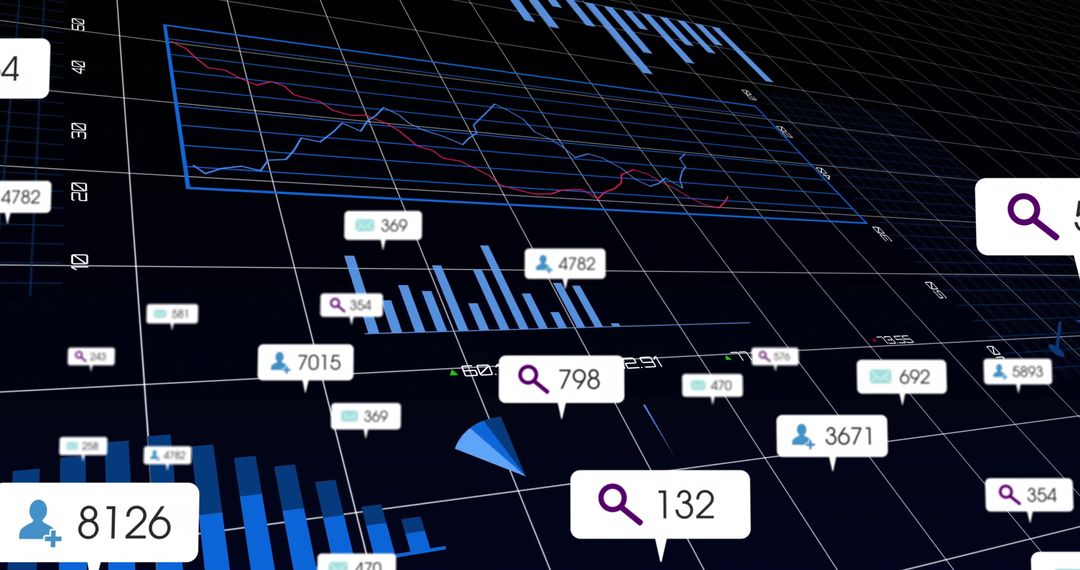
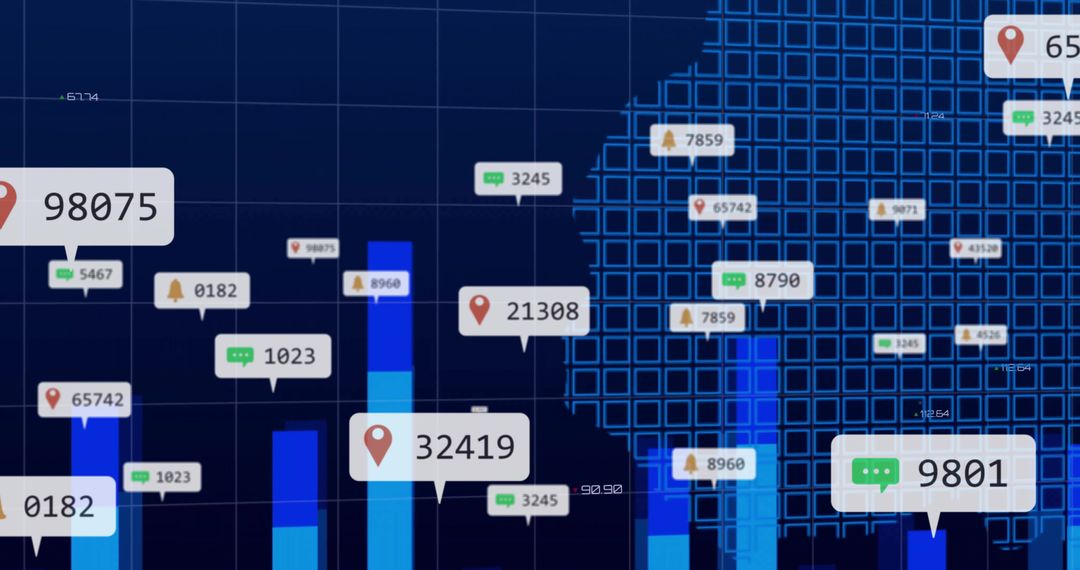
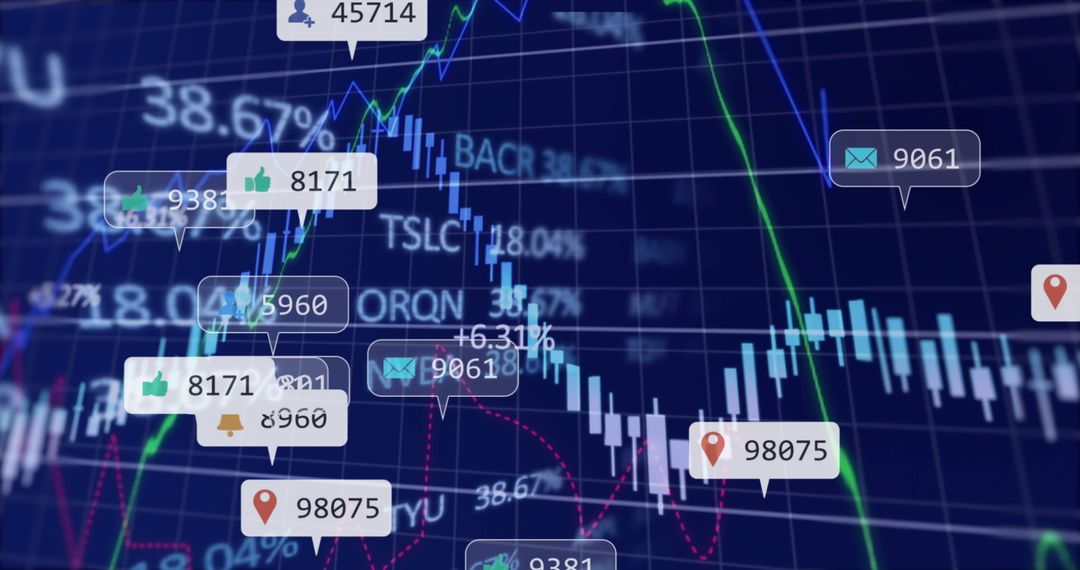
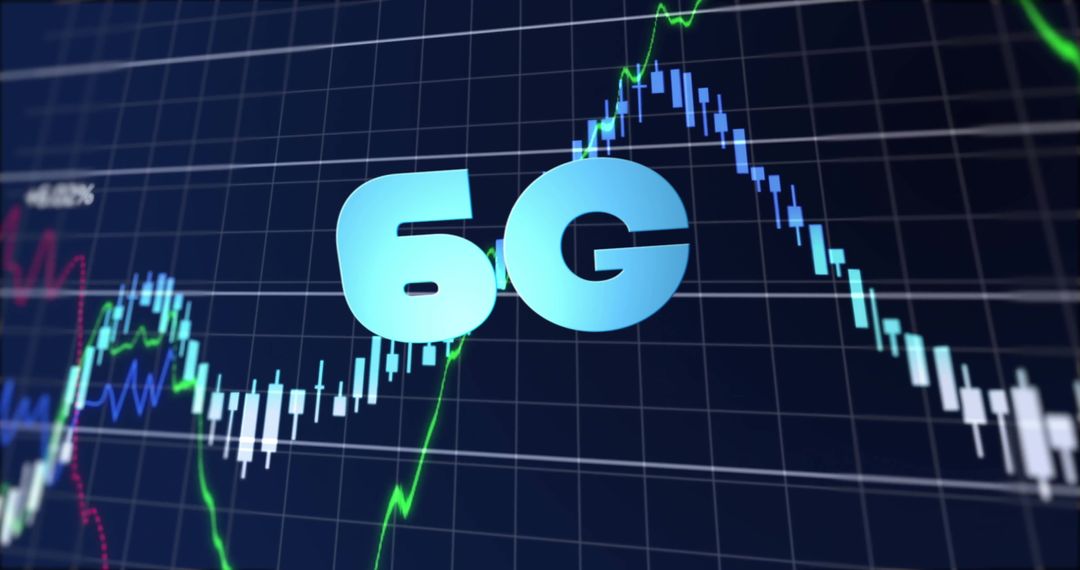
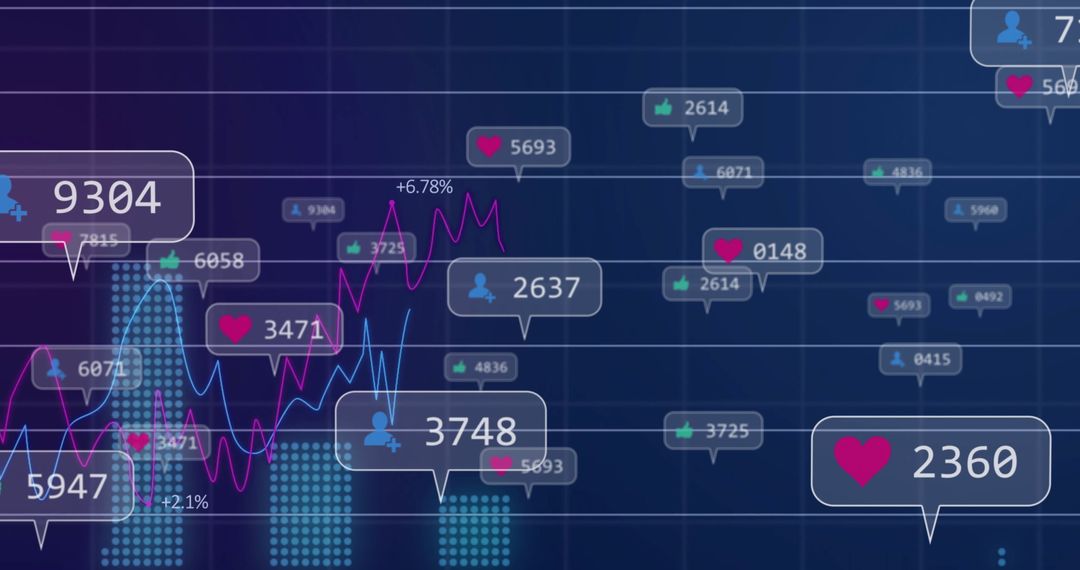
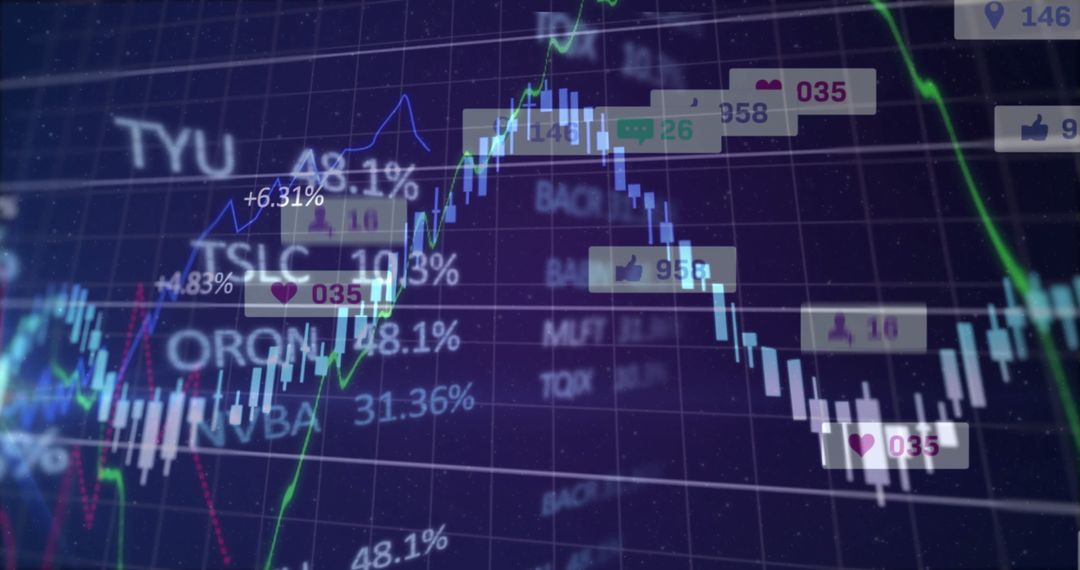
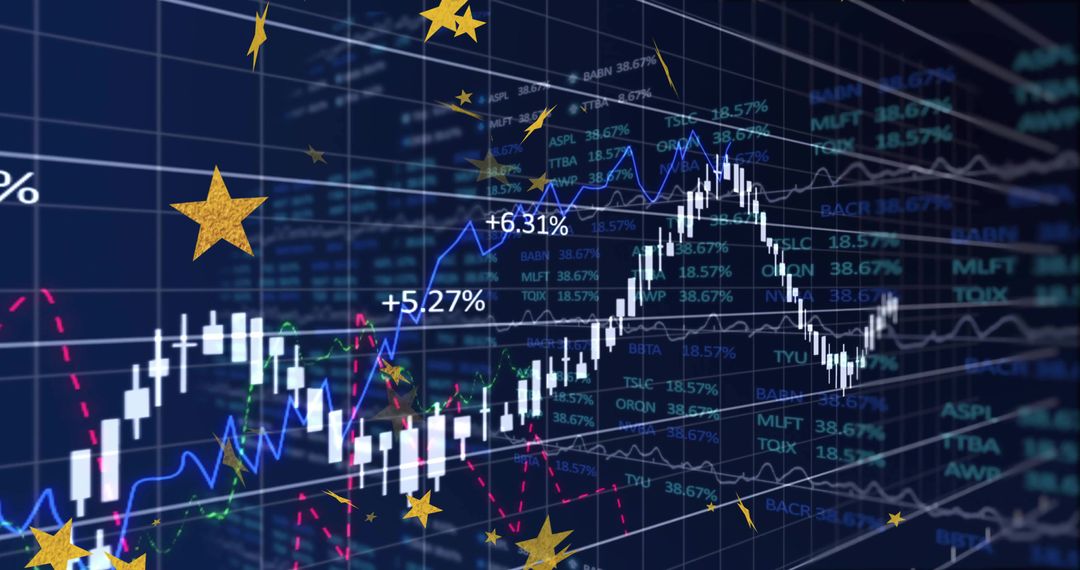
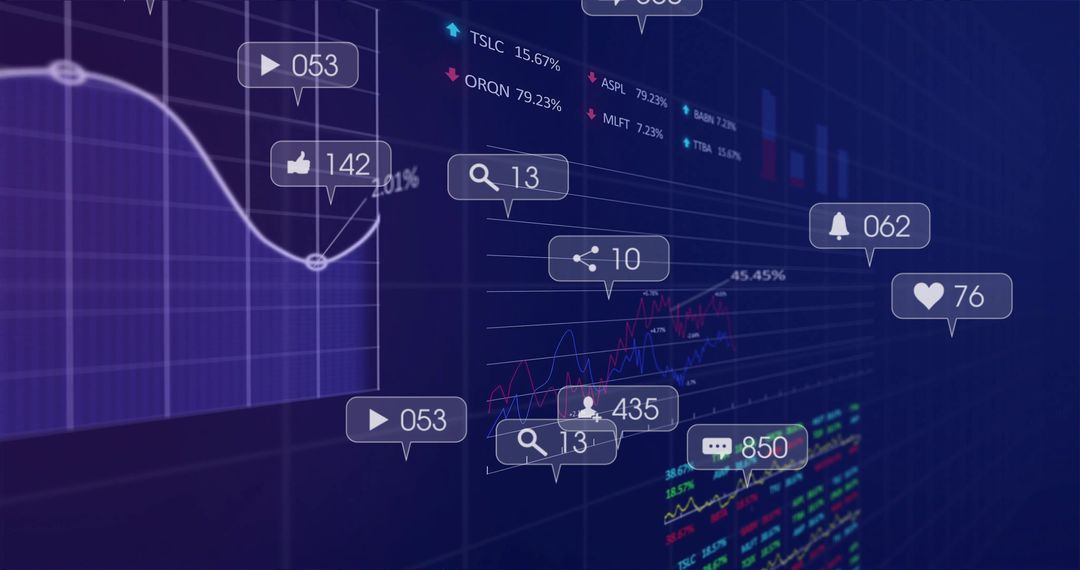
- Digital Dashboard with Financial Metrics and Social Notifications
Digital Dashboard with Financial Metrics and Social Notifications Image

Visual representation depicting market analytics intertwined with social media engagement metrics appeals to financial analysts, digital marketers, or anyone interested in stock market trends. Ideal for articles or presentations on digital finance, social media influence in trading, or modern data-driven decision-making processes.
Powered by 


0
downloads
downloads
Tags:
More
Credit Photo
If you would like to credit the Photo, here are some ways you can do so
Text Link
photo Link
<span class="text-link">
<span>
<a target="_blank" href=https://pikwizard.com/photo/digital-dashboard-with-financial-metrics-and-social-notifications/43e8bbfe80b392d29a3ecc539ee16c17/>PikWizard</a>
</span>
</span>
<span class="image-link">
<span
style="margin: 0 0 20px 0; display: inline-block; vertical-align: middle; width: 100%;"
>
<a
target="_blank"
href="https://pikwizard.com/photo/digital-dashboard-with-financial-metrics-and-social-notifications/43e8bbfe80b392d29a3ecc539ee16c17/"
style="text-decoration: none; font-size: 10px; margin: 0;"
>
<img src="https://pikwizard.com/pw/medium/43e8bbfe80b392d29a3ecc539ee16c17.jpg" style="margin: 0; width: 100%;" alt="" />
<p style="font-size: 12px; margin: 0;">PikWizard</p>
</a>
</span>
</span>
Free (free of charge)
Free for personal and commercial use.
Author: People Creations
Similar Free Stock Images

Premium


Premium


Premium


Premium


Premium


Premium


Premium


Premium


Premium


Premium


Premium


Premium


Premium


Premium


Premium


Premium


Premium


Premium


Premium


Premium


Premium


Premium


Premium


Premium

