- Home >
- Stock Photos >
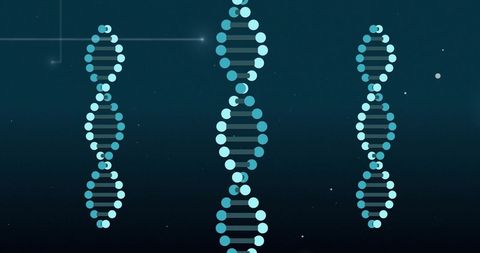
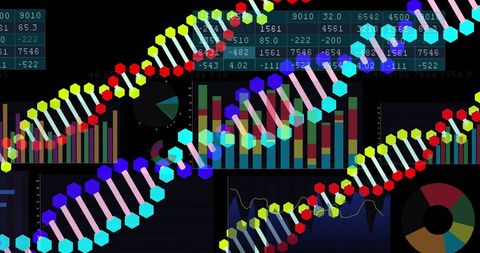
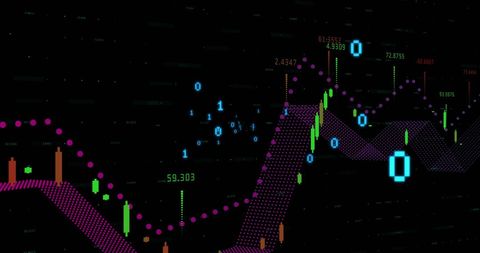
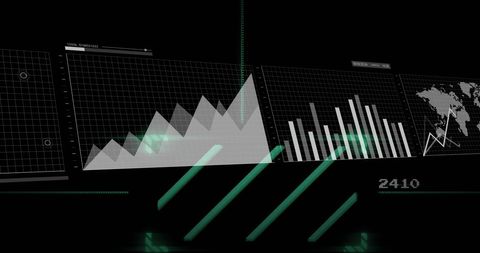
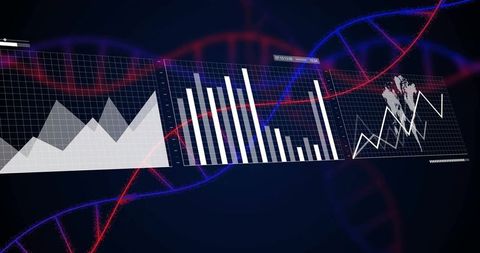
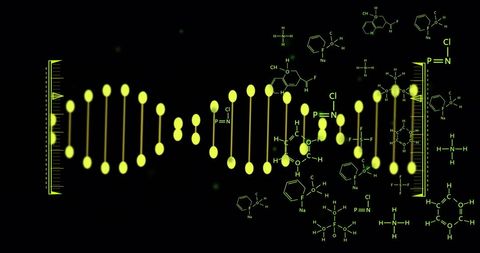
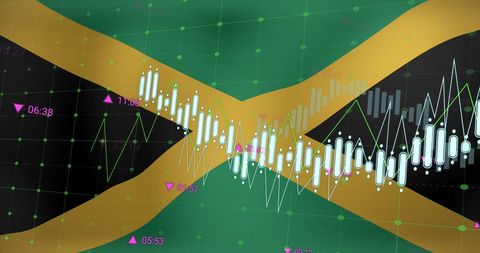
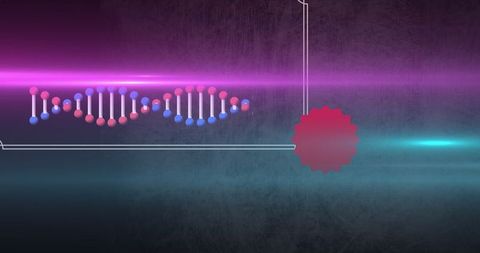
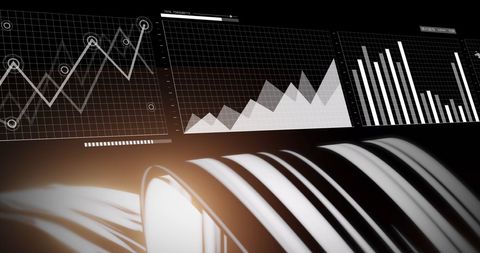
- Digital Dashboard with Genetic Helix and Data Visualization
Digital Dashboard with Genetic Helix and Data Visualization Image
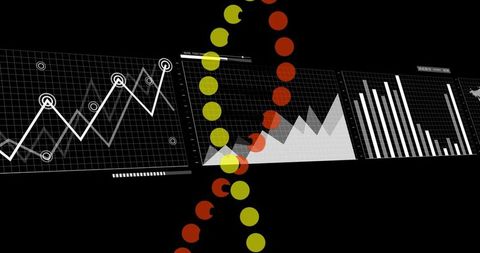
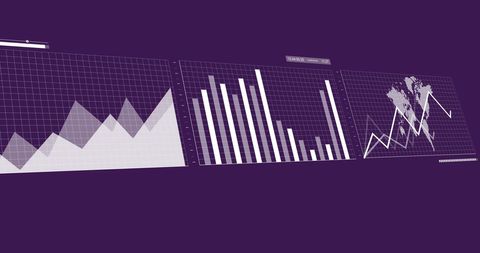
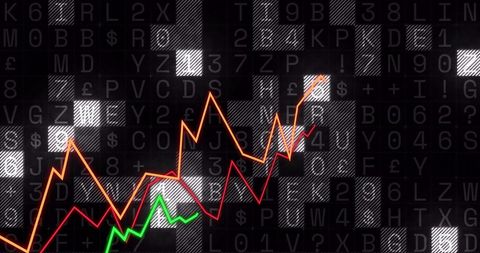
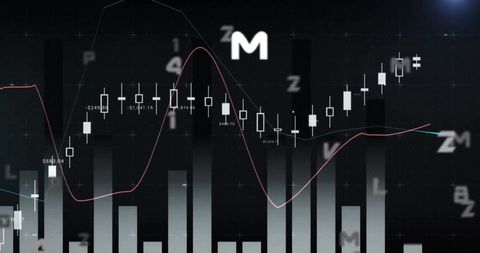
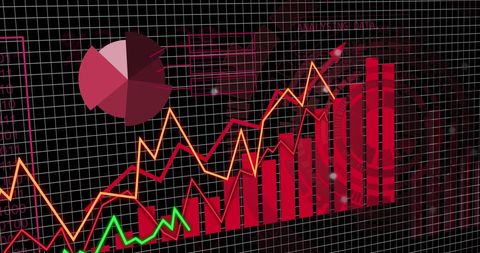
The image showcases a sophisticated analytics dashboard featuring various data charts including line graphs, bar graphs, and an area graph set against a dark interface. A prominent mustard and orange helix runs vertically, adding a unique touch combining technology and genetic visual themes. This comprehensive visualization can be used for presentations on data science, technological interfaces, bioinformatics, or explaining the impact of technology on genetic research and business analytics.
Powered by 


downloads
Tags:
More
Credit Photo
If you would like to credit the Photo, here are some ways you can do so
Text Link
photo Link
<span class="text-link">
<span>
<a target="_blank" href=https://pikwizard.com/photo/digital-dashboard-with-genetic-helix-and-data-visualization/6c43758e2a08d7914f7efb52242b0b2f/>PikWizard</a>
</span>
</span>
<span class="image-link">
<span
style="margin: 0 0 20px 0; display: inline-block; vertical-align: middle; width: 100%;"
>
<a
target="_blank"
href="https://pikwizard.com/photo/digital-dashboard-with-genetic-helix-and-data-visualization/6c43758e2a08d7914f7efb52242b0b2f/"
style="text-decoration: none; font-size: 10px; margin: 0;"
>
<img src="https://pikwizard.com/pw/medium/6c43758e2a08d7914f7efb52242b0b2f.jpg" style="margin: 0; width: 100%;" alt="" />
<p style="font-size: 12px; margin: 0;">PikWizard</p>
</a>
</span>
</span>
Free (free of charge)
Free for personal and commercial use.
Author: Creative Art