
- Home >
- Stock Photos >
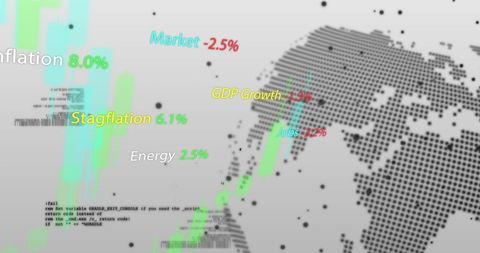
- Digital Dashboard with Global Map and Financial Analytics Interface
Digital Dashboard with Global Map and Financial Analytics Interface Image

This illustration features a sophisticated digital dashboard designing data analysis through a teal global map on a dark interface. Bars represent varying financial metrics, enabling insight into trends which is essential for investors and analysts focusing on international investments and market movements. Clear visibility of charts, currency metrics, and buy and sell buttons make it ideal for applications in financial software interfaces or presentations about economic trends or technological advances in trading platforms.
Powered by 


downloads
Tags:
More
Credit Photo
If you would like to credit the Photo, here are some ways you can do so
Text Link
photo Link
<span class="text-link">
<span>
<a target="_blank" href=https://pikwizard.com/photo/digital-dashboard-with-global-map-and-financial-analytics-interface/7e5eca71bb76221679bc98722ac7c9d0/>PikWizard</a>
</span>
</span>
<span class="image-link">
<span
style="margin: 0 0 20px 0; display: inline-block; vertical-align: middle; width: 100%;"
>
<a
target="_blank"
href="https://pikwizard.com/photo/digital-dashboard-with-global-map-and-financial-analytics-interface/7e5eca71bb76221679bc98722ac7c9d0/"
style="text-decoration: none; font-size: 10px; margin: 0;"
>
<img src="https://pikwizard.com/pw/medium/7e5eca71bb76221679bc98722ac7c9d0.jpg" style="margin: 0; width: 100%;" alt="" />
<p style="font-size: 12px; margin: 0;">PikWizard</p>
</a>
</span>
</span>
Free (free of charge)
Free for personal and commercial use.
Author: Authentic Images
Similar Free Stock Images

Premium


Premium

Premium

Premium

Premium


Premium


Premium


Premium


Premium


Premium


Premium


Premium


Premium


Premium


Premium

Premium

Premium

Premium


Premium


Premium


Premium


Premium


Premium

Premium


Premium


Explore More Free Stock Images