- Home >
- Stock Photos >
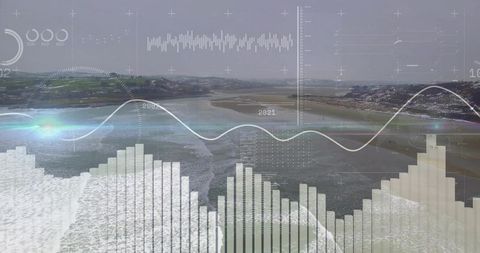
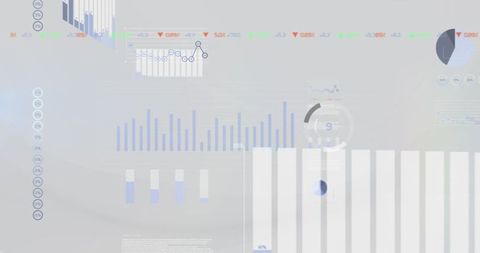
- Digital Dashboard with Graphs and Interactive Elements
Digital Dashboard with Graphs and Interactive Elements Image

Dashboard visual represents technological analytics interface with graphs and data points. Timelines enhance high-tech feel, interactive elements like Subscribe, Play, and Like icons add engagement indicating digital marketing or media context. Useful for presentations, tech-related articles, or visual illustrations of data-driven strategies.

downloads
Tags:
More
Credit Photo
If you would like to credit the Photo, here are some ways you can do so
Text Link
photo Link
<span class="text-link">
<span>
<a target="_blank" href=https://pikwizard.com/photo/digital-dashboard-with-graphs-and-interactive-elements/4fa0348e7cf6275c60c87e6160f301b7/>PikWizard</a>
</span>
</span>
<span class="image-link">
<span
style="margin: 0 0 20px 0; display: inline-block; vertical-align: middle; width: 100%;"
>
<a
target="_blank"
href="https://pikwizard.com/photo/digital-dashboard-with-graphs-and-interactive-elements/4fa0348e7cf6275c60c87e6160f301b7/"
style="text-decoration: none; font-size: 10px; margin: 0;"
>
<img src="https://pikwizard.com/pw/medium/4fa0348e7cf6275c60c87e6160f301b7.jpg" style="margin: 0; width: 100%;" alt="" />
<p style="font-size: 12px; margin: 0;">PikWizard</p>
</a>
</span>
</span>
Free (free of charge)
Free for personal and commercial use.
Author: Authentic Images