- Home >
- Stock Photos >
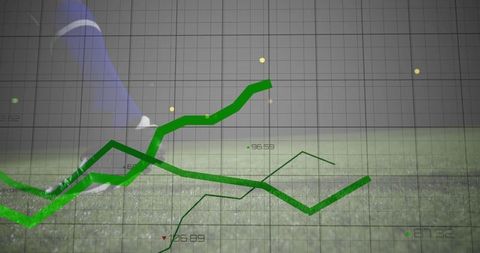
- Digital Dashboard with Green Trend Line and Data Visualization Indicators
Digital Dashboard with Green Trend Line and Data Visualization Indicators Image
Image showing a digital dashboard featuring a dominant green trend line on a blue-gray grid, with numeric labels indicating data points and alert icons for significant values. Useful for illustrating concepts of data analysis, business performance tracking, or analytical software interfaces. Ideal for presentations, reports, and articles focused on data analytics, financial forecasting, or business intelligence.

downloads
Tags:
More
Credit Photo
If you would like to credit the Photo, here are some ways you can do so
Text Link
photo Link
<span class="text-link">
<span>
<a target="_blank" href=https://pikwizard.com/photo/digital-dashboard-with-green-trend-line-and-data-visualization-indicators/c487551dcc18ba227c8fb5ae01679ca3/>PikWizard</a>
</span>
</span>
<span class="image-link">
<span
style="margin: 0 0 20px 0; display: inline-block; vertical-align: middle; width: 100%;"
>
<a
target="_blank"
href="https://pikwizard.com/photo/digital-dashboard-with-green-trend-line-and-data-visualization-indicators/c487551dcc18ba227c8fb5ae01679ca3/"
style="text-decoration: none; font-size: 10px; margin: 0;"
>
<img src="https://pikwizard.com/pw/medium/c487551dcc18ba227c8fb5ae01679ca3.jpg" style="margin: 0; width: 100%;" alt="" />
<p style="font-size: 12px; margin: 0;">PikWizard</p>
</a>
</span>
</span>
Free (free of charge)
Free for personal and commercial use.
Author: Creative Art