
- Home >
- Stock Photos >
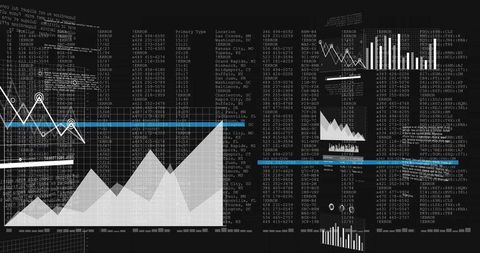
- Digital Dashboard with Interactive Data Charts on Black Background
Digital Dashboard with Interactive Data Charts on Black Background Image

White charts and graphs display data against a stark black background, designed to convey complex information. Digital design suggests concepts of data processing, global communication, and interactive user interfaces. Ideal usage includes websites, presentations, and educational materials focused on technology, analytics, or future technology trends competitiveness analysis.
Powered by  - Get 15% off with code: PIKWIZARD15


downloads
Tags:
More
Credit Photo
If you would like to credit the Photo, here are some ways you can do so
Text Link
photo Link
<span class="text-link">
<span>
<a target="_blank" href=https://pikwizard.com/photo/digital-dashboard-with-interactive-data-charts-on-black-background/3a83e7cf4ec35a31b7fe667047a5653d/>PikWizard</a>
</span>
</span>
<span class="image-link">
<span
style="margin: 0 0 20px 0; display: inline-block; vertical-align: middle; width: 100%;"
>
<a
target="_blank"
href="https://pikwizard.com/photo/digital-dashboard-with-interactive-data-charts-on-black-background/3a83e7cf4ec35a31b7fe667047a5653d/"
style="text-decoration: none; font-size: 10px; margin: 0;"
>
<img src="https://pikwizard.com/pw/medium/3a83e7cf4ec35a31b7fe667047a5653d.jpg" style="margin: 0; width: 100%;" alt="" />
<p style="font-size: 12px; margin: 0;">PikWizard</p>
</a>
</span>
</span>
Free (free of charge)
Free for personal and commercial use.
Author: Awesome Content
Similar Free Stock Images

Premium


Premium

Premium


Premium


Premium

Premium


Premium

Premium


Premium


Premium


Premium


Premium


Premium


Premium


Premium


Premium


Premium


Premium

Premium


Premium


Premium


Premium


Premium


Premium


Premium


Explore More Free Stock Images