
- Home >
- Stock Photos >
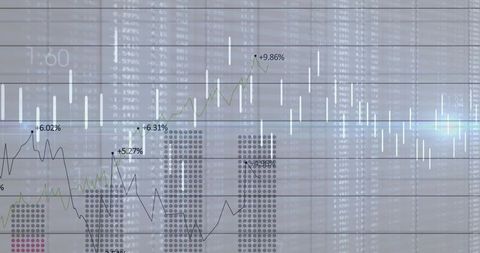
- Digital Dashboard with Line Charts and Data Analytics Visualization
Digital Dashboard with Line Charts and Data Analytics Visualization Image

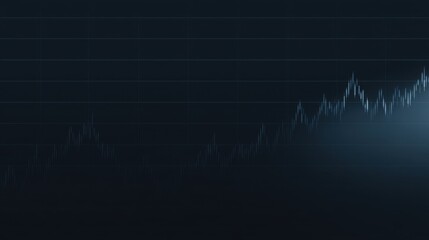
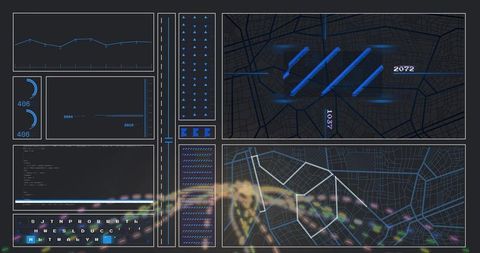
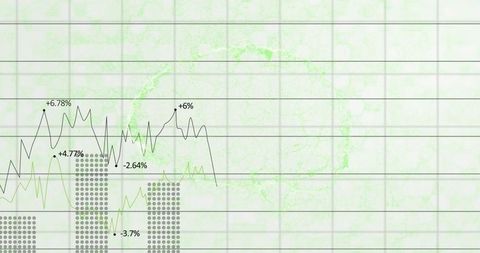
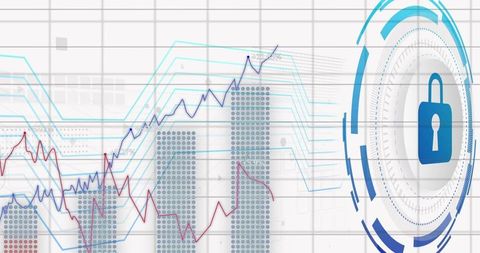
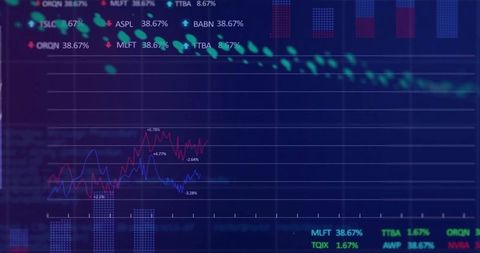
This dashboard showcases financial data analysis with dynamic line graphs, dotted bars, percent labels, and stock tickers. It visually communicates complex data trends and is ideal for financial Analysts, business presentations, or economic trend assessments.
Powered by 


downloads
Tags:
More
Credit Photo
If you would like to credit the Photo, here are some ways you can do so
Text Link
photo Link
<span class="text-link">
<span>
<a target="_blank" href=https://pikwizard.com/photo/digital-dashboard-with-line-charts-and-data-analytics-visualization/a9a14c050d38bcb8b37100146571e71c/>PikWizard</a>
</span>
</span>
<span class="image-link">
<span
style="margin: 0 0 20px 0; display: inline-block; vertical-align: middle; width: 100%;"
>
<a
target="_blank"
href="https://pikwizard.com/photo/digital-dashboard-with-line-charts-and-data-analytics-visualization/a9a14c050d38bcb8b37100146571e71c/"
style="text-decoration: none; font-size: 10px; margin: 0;"
>
<img src="https://pikwizard.com/pw/medium/a9a14c050d38bcb8b37100146571e71c.jpg" style="margin: 0; width: 100%;" alt="" />
<p style="font-size: 12px; margin: 0;">PikWizard</p>
</a>
</span>
</span>
Free (free of charge)
Free for personal and commercial use.
Author: Creative Art
Similar Free Stock Images

Premium


Premium
Premium


Premium

Premium


Premium


Premium


Premium

Premium


Premium


Premium


Premium


Premium

Premium


Premium


Premium
Premium

Premium


Premium


Premium

Premium


Premium

Premium

Premium

Premium


Explore More Free Stock Images