
- Home >
- Stock Photos >
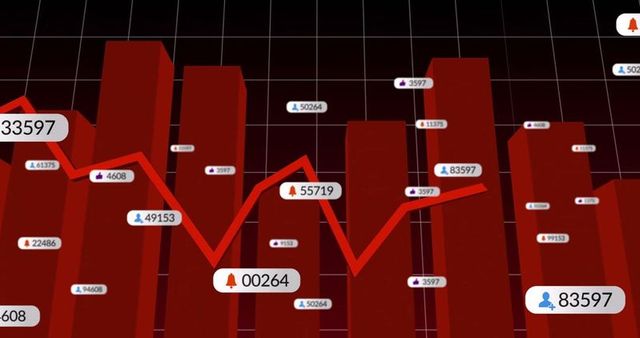
- Digital Dashboard with Red Bar and Line Graphs in Data Visualization
Digital Dashboard with Red Bar and Line Graphs in Data Visualization Image

Illustration depicting red bar and line graphs on a digital dashboard, overlayed with network icons, symbolizing analytics and data visualization. This can be utilized in business intelligence presentations, technology-related articles, and educational materials focused on data analysis or digital interfaces.
Powered by  - Get 15% off with code: PIKWIZARD15


downloads
Tags:
More
Credit Photo
If you would like to credit the Photo, here are some ways you can do so
Text Link
photo Link
<span class="text-link">
<span>
<a target="_blank" href=https://pikwizard.com/photo/digital-dashboard-with-red-bar-and-line-graphs-in-data-visualization/b70c4d0bac57973d75f96cfd76fcb418/>PikWizard</a>
</span>
</span>
<span class="image-link">
<span
style="margin: 0 0 20px 0; display: inline-block; vertical-align: middle; width: 100%;"
>
<a
target="_blank"
href="https://pikwizard.com/photo/digital-dashboard-with-red-bar-and-line-graphs-in-data-visualization/b70c4d0bac57973d75f96cfd76fcb418/"
style="text-decoration: none; font-size: 10px; margin: 0;"
>
<img src="https://pikwizard.com/pw/medium/b70c4d0bac57973d75f96cfd76fcb418.jpg" style="margin: 0; width: 100%;" alt="" />
<p style="font-size: 12px; margin: 0;">PikWizard</p>
</a>
</span>
</span>
Free (free of charge)
Free for personal and commercial use.
Author: Authentic Images
Similar Free Stock Images

Premium


Premium


Premium


Premium


Premium


Premium


Premium


Premium


Premium


Premium

Premium


Premium


Premium


Premium


Premium

Premium

Premium


Premium


Premium


Premium


Premium


Premium

Premium


Premium


Premium


Explore More Free Stock Images