
- Home >
- Stock Photos >
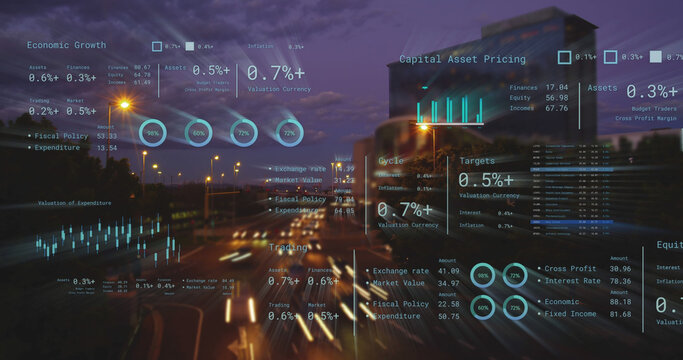
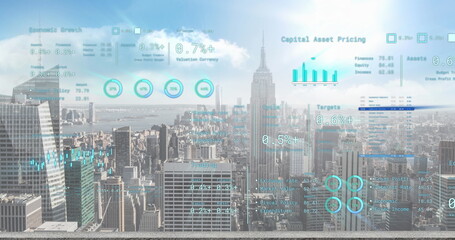
- Digital Data Analysis Against Abstract Cityscape
Digital Data Analysis Against Abstract Cityscape Image

Digital representation of financial data analysis blending over abstract cityscape. Useful for illustrating tech-driven financial analysis, global business, and modern financial tools in presentations, websites, and educational materials.
Powered by 


downloads
Tags:
More
Credit Photo
If you would like to credit the Photo, here are some ways you can do so
Text Link
photo Link
<span class="text-link">
<span>
<a target="_blank" href=https://pikwizard.com/photo/digital-data-analysis-against-abstract-cityscape/71f7ced04bfb1e32eb14f1dcc9f5668e/>PikWizard</a>
</span>
</span>
<span class="image-link">
<span
style="margin: 0 0 20px 0; display: inline-block; vertical-align: middle; width: 100%;"
>
<a
target="_blank"
href="https://pikwizard.com/photo/digital-data-analysis-against-abstract-cityscape/71f7ced04bfb1e32eb14f1dcc9f5668e/"
style="text-decoration: none; font-size: 10px; margin: 0;"
>
<img src="https://pikwizard.com/pw/medium/71f7ced04bfb1e32eb14f1dcc9f5668e.jpg" style="margin: 0; width: 100%;" alt="" />
<p style="font-size: 12px; margin: 0;">PikWizard</p>
</a>
</span>
</span>
Free (free of charge)
Free for personal and commercial use.
Author: Authentic Images
Similar Free Stock Images

Premium


Premium


Premium


Premium


Premium


Premium


Premium


Premium


Premium


Premium


Premium


Premium


Premium

Premium

Premium


Premium


Premium


Premium


Premium


Premium


Premium


Premium


Premium


Premium


Premium


Explore More Free Stock Images