- Home >
- Stock Photos >
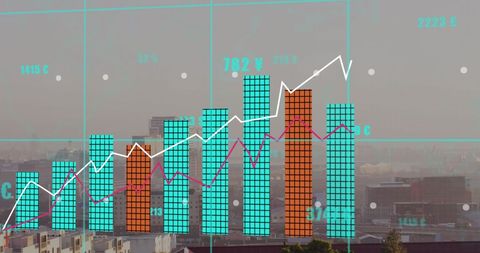
- Digital Data Analysis and Financial Growth Concept
Digital Data Analysis and Financial Growth Concept Image

Illustrates complexities of digital data processing and financial analysis. Ideal for publications on economic growth patterns and use in tech-driven financial services. Useful for analytical insights in reports, presentations, or online content focused on modern business strategies and technological integration.

downloads
Tags:
More
Credit Photo
If you would like to credit the Photo, here are some ways you can do so
Text Link
photo Link
<span class="text-link">
<span>
<a target="_blank" href=https://pikwizard.com/photo/digital-data-analysis-and-financial-growth-concept/d7bf8041a7543f959e7fa7a2ae2a651f/>PikWizard</a>
</span>
</span>
<span class="image-link">
<span
style="margin: 0 0 20px 0; display: inline-block; vertical-align: middle; width: 100%;"
>
<a
target="_blank"
href="https://pikwizard.com/photo/digital-data-analysis-and-financial-growth-concept/d7bf8041a7543f959e7fa7a2ae2a651f/"
style="text-decoration: none; font-size: 10px; margin: 0;"
>
<img src="https://pikwizard.com/pw/medium/d7bf8041a7543f959e7fa7a2ae2a651f.jpg" style="margin: 0; width: 100%;" alt="" />
<p style="font-size: 12px; margin: 0;">PikWizard</p>
</a>
</span>
</span>
Free (free of charge)
Free for personal and commercial use.
Author: People Creations