- Home >
- Stock Photos >
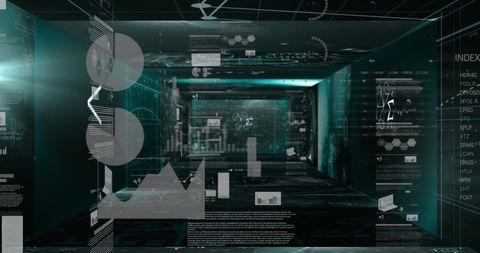
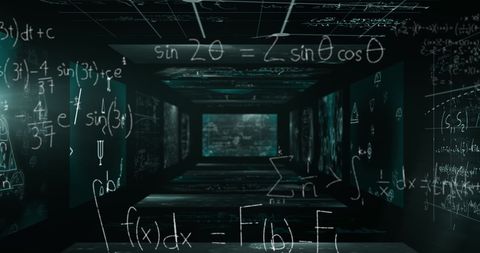
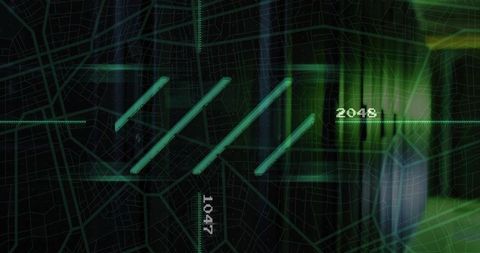
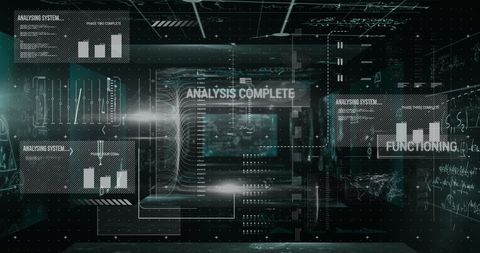
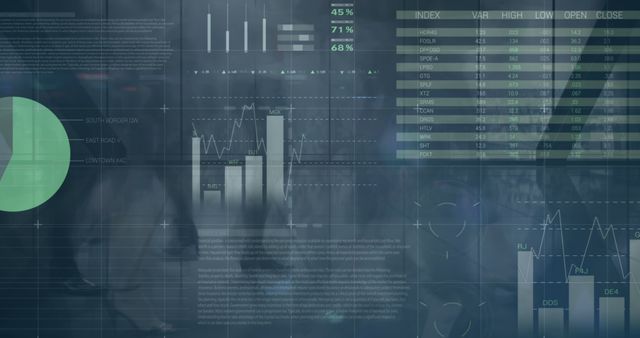
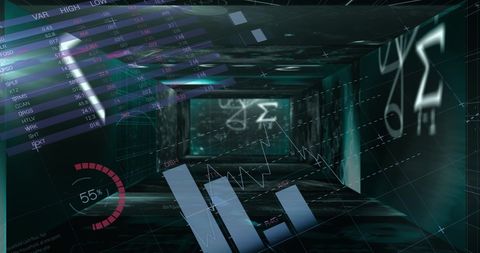
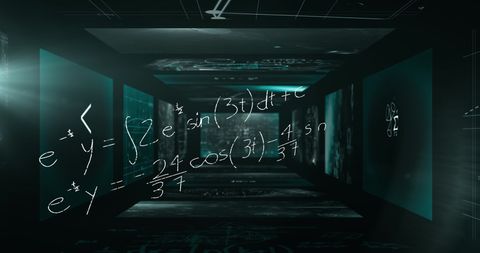
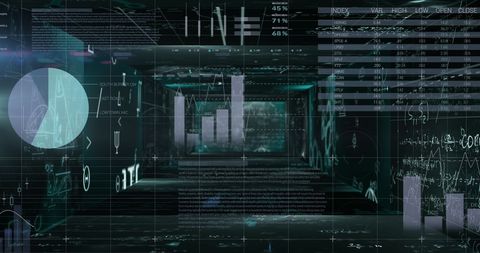
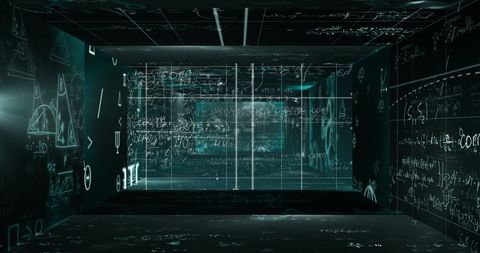
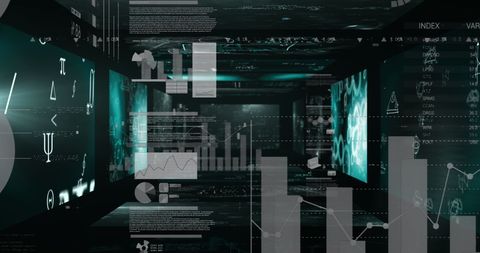
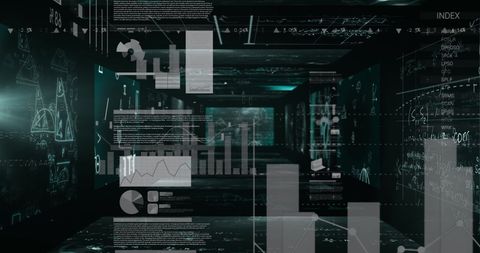
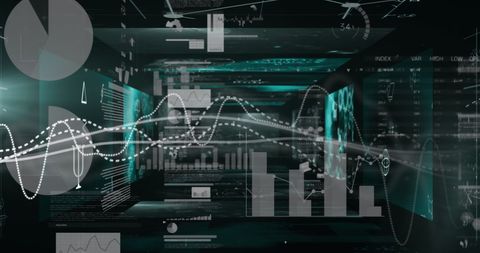
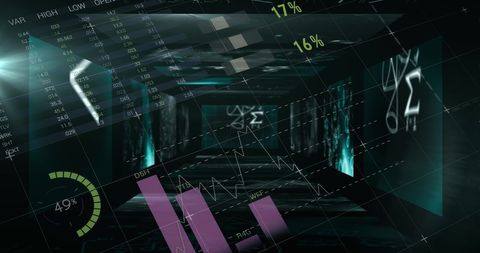
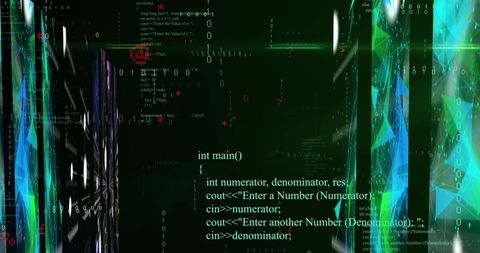
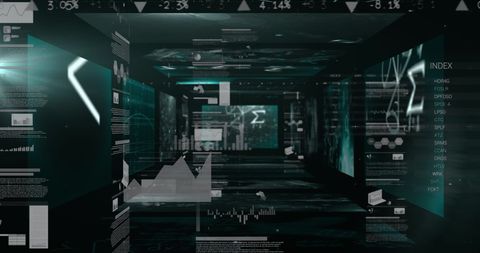
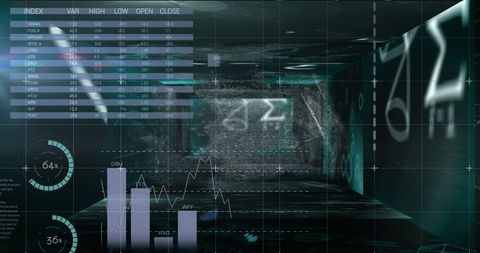
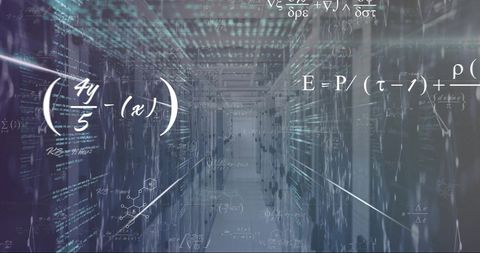
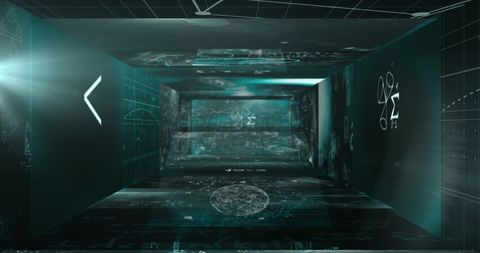
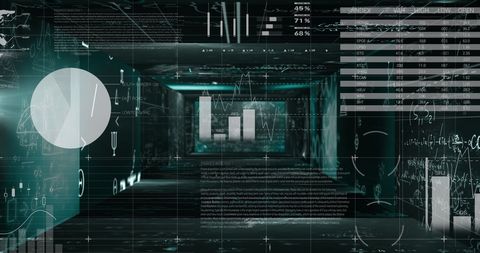
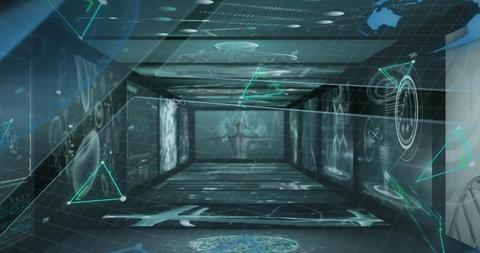
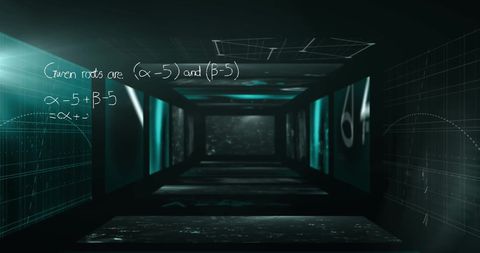
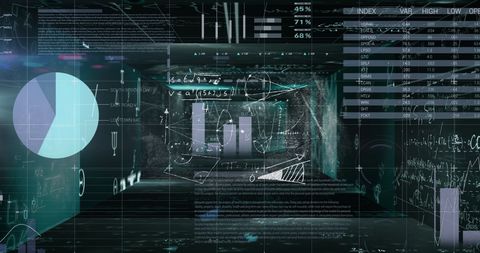
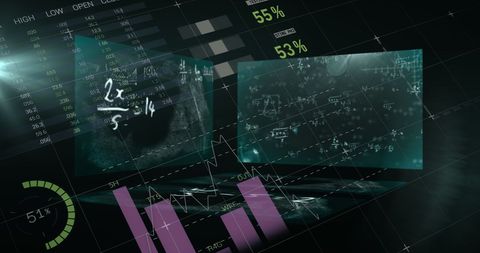
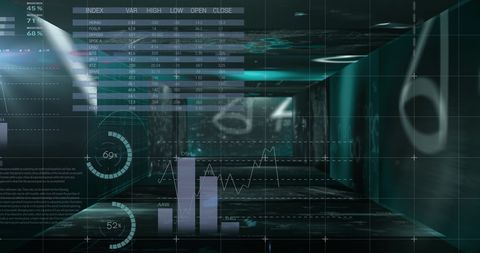
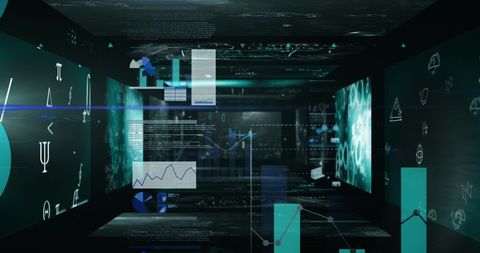
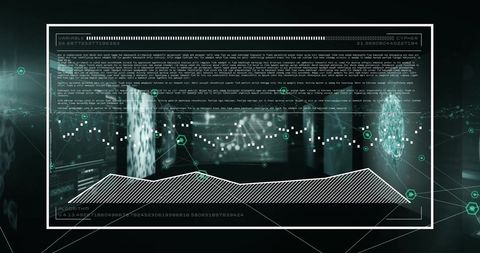
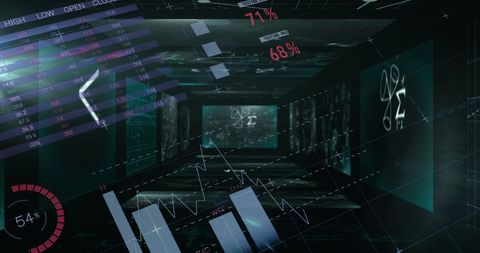
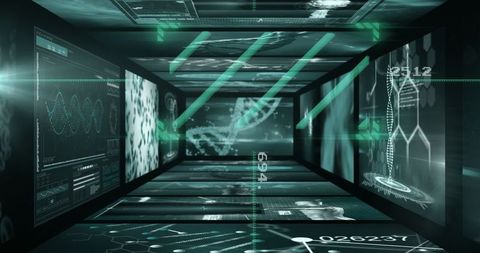
- Digital Data Analysis and Graph Display in High-Tech Environment
Digital Data Analysis and Graph Display in High-Tech Environment Image
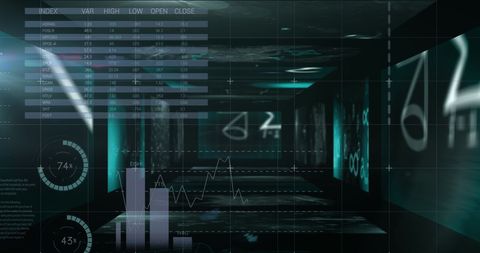
This futuristic scene depicts a flow of data, charts, and graphs overlaying a light-filled corridor of screens with mathematical equations. Useful for illustrating the concepts of data science, financial analysis, or cutting-edge research environments in promotional materials, digital backgrounds, or educational publications highlighting modern technology and analytical processes.

downloads
Tags:
More
Credit Photo
If you would like to credit the Photo, here are some ways you can do so
Text Link
photo Link
<span class="text-link">
<span>
<a target="_blank" href=https://pikwizard.com/photo/digital-data-analysis-and-graph-display-in-high-tech-environment/650451b011fb16da1a37e929c6aab090/>PikWizard</a>
</span>
</span>
<span class="image-link">
<span
style="margin: 0 0 20px 0; display: inline-block; vertical-align: middle; width: 100%;"
>
<a
target="_blank"
href="https://pikwizard.com/photo/digital-data-analysis-and-graph-display-in-high-tech-environment/650451b011fb16da1a37e929c6aab090/"
style="text-decoration: none; font-size: 10px; margin: 0;"
>
<img src="https://pikwizard.com/pw/medium/650451b011fb16da1a37e929c6aab090.jpg" style="margin: 0; width: 100%;" alt="" />
<p style="font-size: 12px; margin: 0;">PikWizard</p>
</a>
</span>
</span>
Free (free of charge)
Free for personal and commercial use.
Author: Creative Art