
- Home >
- Stock Photos >
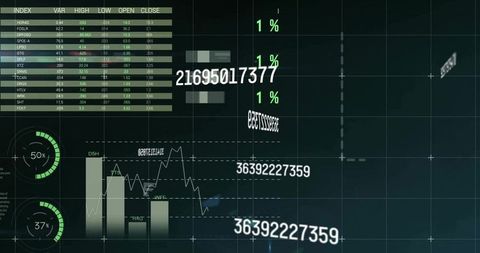
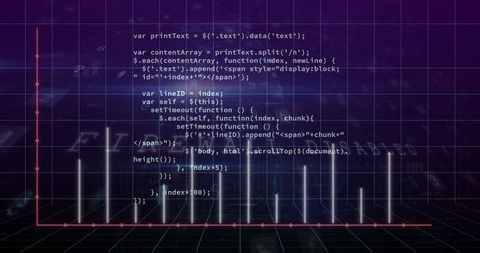
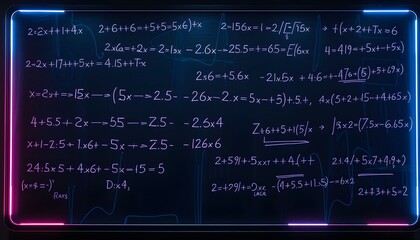
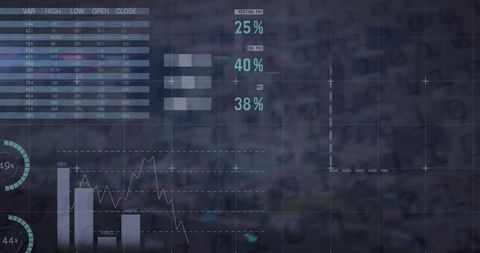
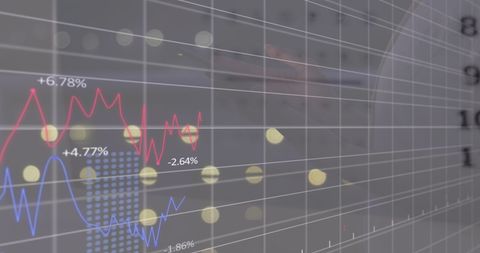
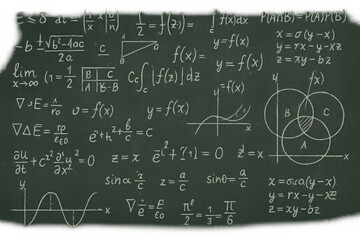
- Digital Data Analysis and Mathematical Overlay
Digital Data Analysis and Mathematical Overlay Image

Digital data analysis concept showing mathematical graphs and equations overlayed on statistics display. Useful for illustrating modern technology applications, financial analytics concepts, and hi-tech computing themes in presentations or marketing materials emphasizing innovation. Ideal for use in academic or technical publications related to computer science or data engineering.
Powered by 


downloads
Tags:
More
Credit Photo
If you would like to credit the Photo, here are some ways you can do so
Text Link
photo Link
<span class="text-link">
<span>
<a target="_blank" href=https://pikwizard.com/photo/digital-data-analysis-and-mathematical-overlay/e257e0dc2a4b8f232ad0c4a2fb0d8c03/>PikWizard</a>
</span>
</span>
<span class="image-link">
<span
style="margin: 0 0 20px 0; display: inline-block; vertical-align: middle; width: 100%;"
>
<a
target="_blank"
href="https://pikwizard.com/photo/digital-data-analysis-and-mathematical-overlay/e257e0dc2a4b8f232ad0c4a2fb0d8c03/"
style="text-decoration: none; font-size: 10px; margin: 0;"
>
<img src="https://pikwizard.com/pw/medium/e257e0dc2a4b8f232ad0c4a2fb0d8c03.jpg" style="margin: 0; width: 100%;" alt="" />
<p style="font-size: 12px; margin: 0;">PikWizard</p>
</a>
</span>
</span>
Free (free of charge)
Free for personal and commercial use.
Author: Authentic Images
Similar Free Stock Images

Premium


Premium

Premium


Premium


Premium


Premium


Premium


Premium

Premium


Premium


Premium


Premium


Premium


Premium


Premium

Premium


Premium


Premium


Premium


Premium

Premium

Premium


Premium

Premium
Premium

Explore More Free Stock Images