- Home >
- Stock Photos >
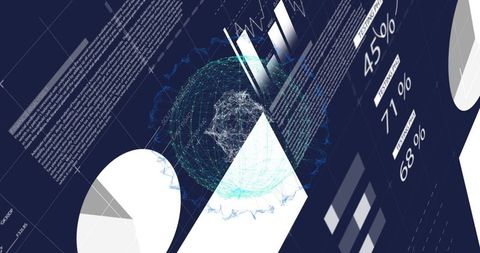
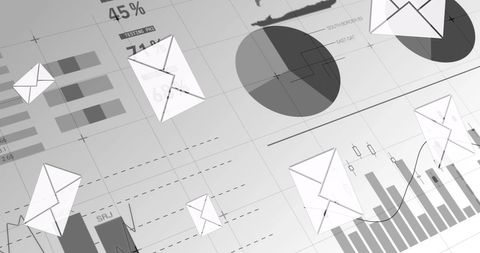
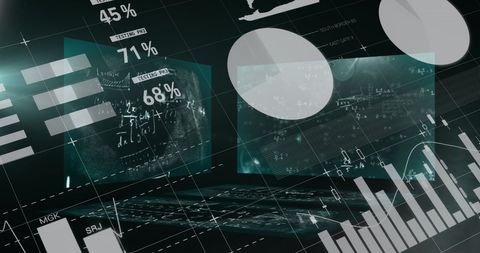
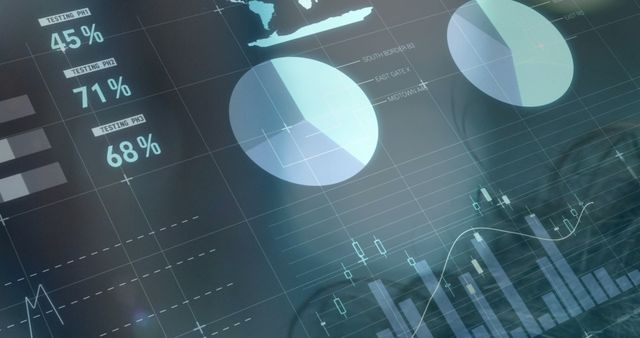
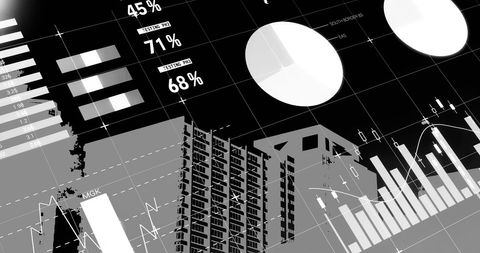
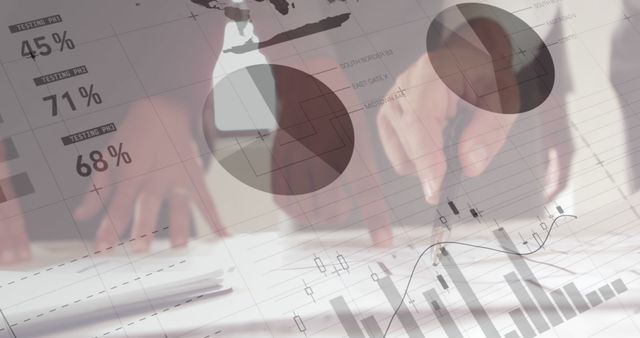
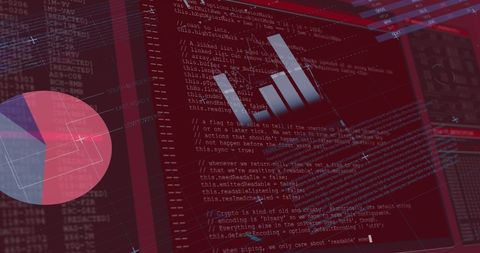
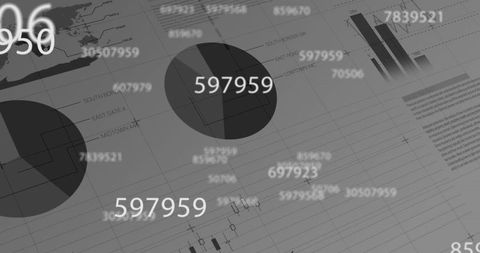
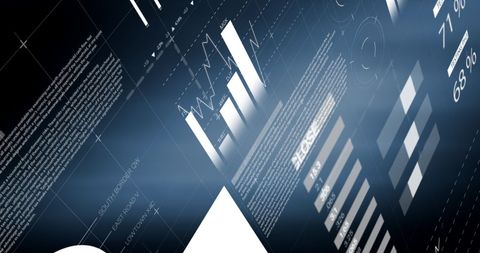
- Digital Data Analysis and Processing Background Concept
Digital Data Analysis and Processing Background Concept Image
Abstract visualization of business data analysis with graphs and charts displayed. Useful for illustrating concepts related to digital data processing, financial analysis, technology trends, and business insights. Ideal for presentations, marketing materials, and articles focusing on data-driven decisions.

downloads
Tags:
More
Credit Photo
If you would like to credit the Photo, here are some ways you can do so
Text Link
photo Link
<span class="text-link">
<span>
<a target="_blank" href=https://pikwizard.com/photo/digital-data-analysis-and-processing-background-concept/2f1f3184c7664d4b726abc7199e6f6f9/>PikWizard</a>
</span>
</span>
<span class="image-link">
<span
style="margin: 0 0 20px 0; display: inline-block; vertical-align: middle; width: 100%;"
>
<a
target="_blank"
href="https://pikwizard.com/photo/digital-data-analysis-and-processing-background-concept/2f1f3184c7664d4b726abc7199e6f6f9/"
style="text-decoration: none; font-size: 10px; margin: 0;"
>
<img src="https://pikwizard.com/pw/medium/2f1f3184c7664d4b726abc7199e6f6f9.jpg" style="margin: 0; width: 100%;" alt="" />
<p style="font-size: 12px; margin: 0;">PikWizard</p>
</a>
</span>
</span>
Free (free of charge)
Free for personal and commercial use.
Author: Creative Art