
- Home >
- Stock Photos >
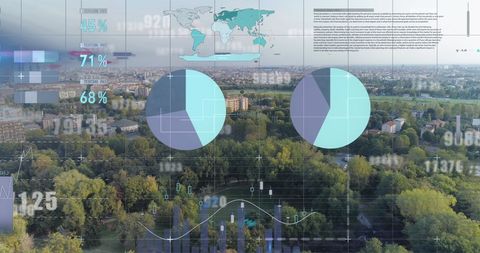
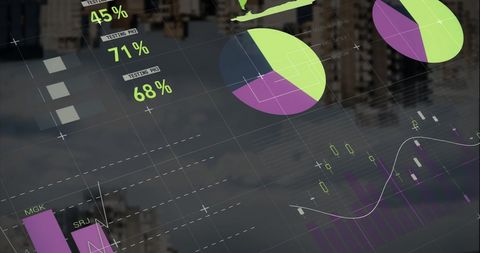
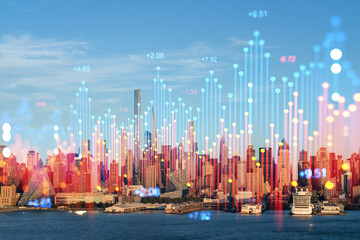
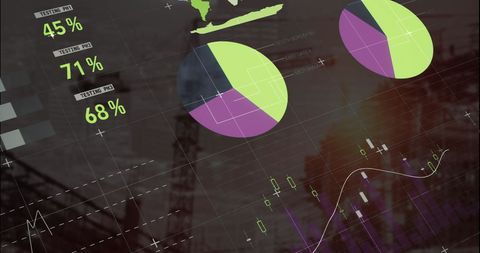
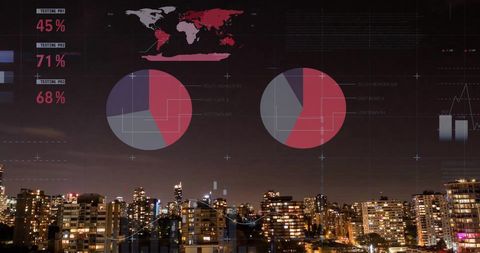
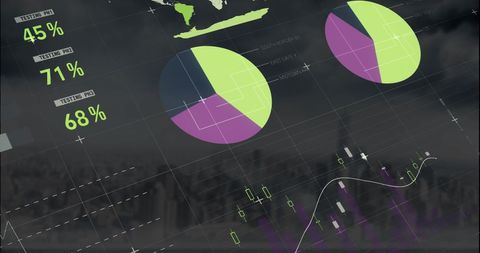
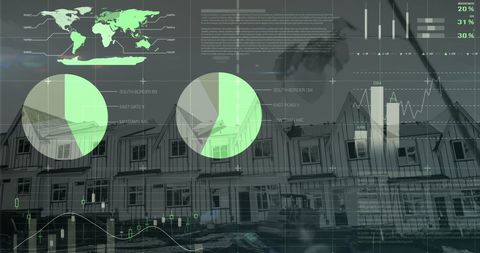
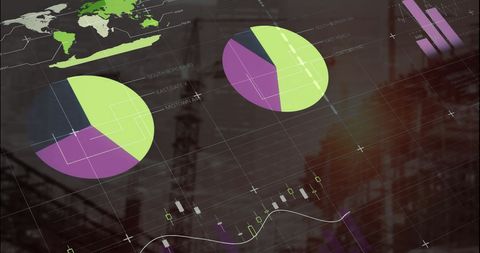
- Digital Data Analysis and Visualization Over Modern Cityscape
Digital Data Analysis and Visualization Over Modern Cityscape Image

Modern depiction of data visualization projected over an urban backdrop suits use in business presentations highlighting technology trends, data processing, and smart city concepts. Ideal for visualizing technological integration across city environments in digital and promotional content.
Powered by 


downloads
Tags:
More
Credit Photo
If you would like to credit the Photo, here are some ways you can do so
Text Link
photo Link
<span class="text-link">
<span>
<a target="_blank" href=https://pikwizard.com/photo/digital-data-analysis-and-visualization-over-modern-cityscape/be0c12ade4d5bbf782a69147511263a9/>PikWizard</a>
</span>
</span>
<span class="image-link">
<span
style="margin: 0 0 20px 0; display: inline-block; vertical-align: middle; width: 100%;"
>
<a
target="_blank"
href="https://pikwizard.com/photo/digital-data-analysis-and-visualization-over-modern-cityscape/be0c12ade4d5bbf782a69147511263a9/"
style="text-decoration: none; font-size: 10px; margin: 0;"
>
<img src="https://pikwizard.com/pw/medium/be0c12ade4d5bbf782a69147511263a9.jpg" style="margin: 0; width: 100%;" alt="" />
<p style="font-size: 12px; margin: 0;">PikWizard</p>
</a>
</span>
</span>
Free (free of charge)
Free for personal and commercial use.
Author: Authentic Images
Similar Free Stock Images

Premium


Premium


Premium


Premium


Premium


Premium

Premium
Premium


Premium


Premium


Premium


Premium


Premium

Premium

Premium


Premium


Premium


Premium


Premium


Premium


Premium


Premium


Premium


Premium


Premium

Explore More Free Stock Images