
- Home >
- Stock Photos >
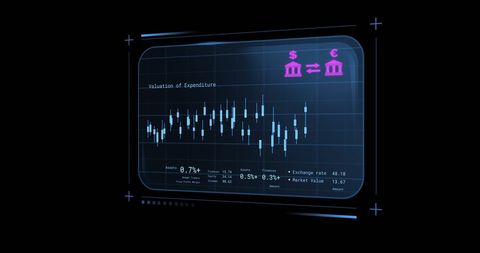
- Digital Data Analysis Display with Graph and Numbers
Digital Data Analysis Display with Graph and Numbers Image

Illustrates themes of digital data analysis and processing, featuring a numerical display with graphs ideal for technology or financial presentations. Great for educational materials about stock markets or financial data interpretation.
Powered by 


downloads
Tags:
More
Credit Photo
If you would like to credit the Photo, here are some ways you can do so
Text Link
photo Link
<span class="text-link">
<span>
<a target="_blank" href=https://pikwizard.com/photo/digital-data-analysis-display-with-graph-and-numbers/cad3fb2028ebabfe32b8ed064e08c574/>PikWizard</a>
</span>
</span>
<span class="image-link">
<span
style="margin: 0 0 20px 0; display: inline-block; vertical-align: middle; width: 100%;"
>
<a
target="_blank"
href="https://pikwizard.com/photo/digital-data-analysis-display-with-graph-and-numbers/cad3fb2028ebabfe32b8ed064e08c574/"
style="text-decoration: none; font-size: 10px; margin: 0;"
>
<img src="https://pikwizard.com/pw/medium/cad3fb2028ebabfe32b8ed064e08c574.jpg" style="margin: 0; width: 100%;" alt="" />
<p style="font-size: 12px; margin: 0;">PikWizard</p>
</a>
</span>
</span>
Free (free of charge)
Free for personal and commercial use.
Author: Awesome Content
Similar Free Stock Images

Premium


Premium


Premium


Premium


Premium


Premium

Premium


Premium


Premium

Premium


Premium


Premium


Premium


Premium


Premium

Premium


Premium


Premium


Premium


Premium


Premium


Premium


Premium


Premium


Premium


Explore More Free Stock Images