1. Home > 
  2. Stock Photos > 
  3. Digital Data Analysis Display with Red Arrows and Graphs

Digital Data Analysis Display with Red Arrows and Graphs Image

Digital Data Analysis Display with Red Arrows and Graphs

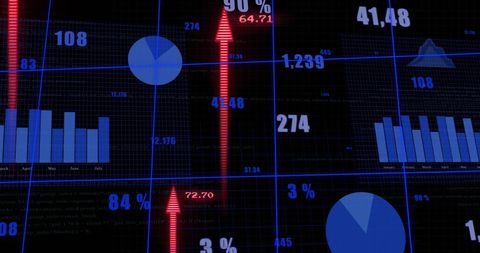
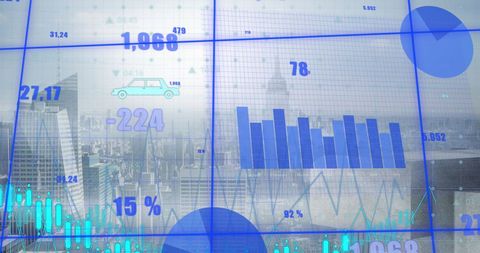
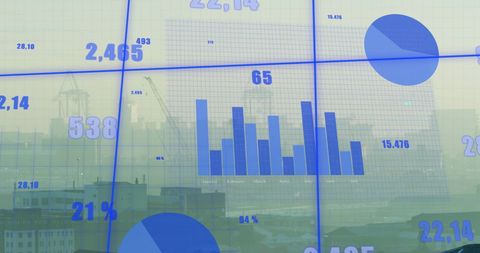
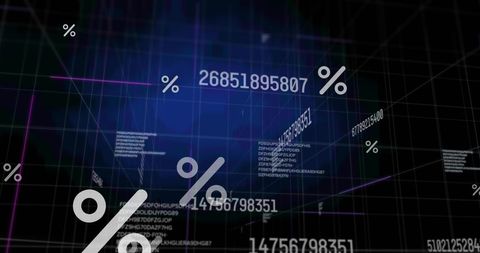
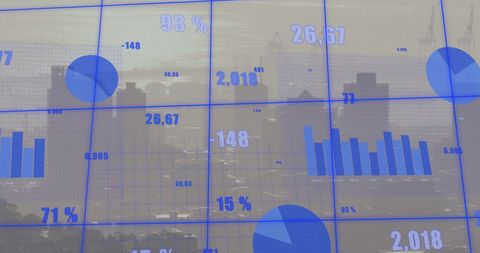
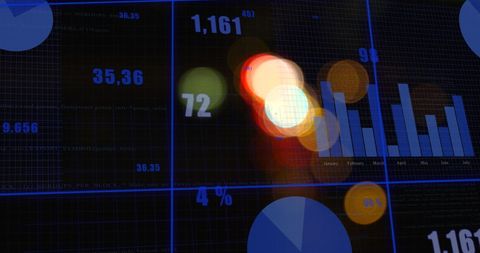
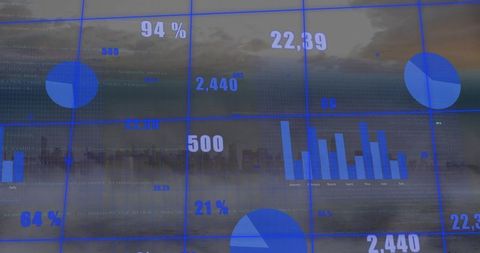
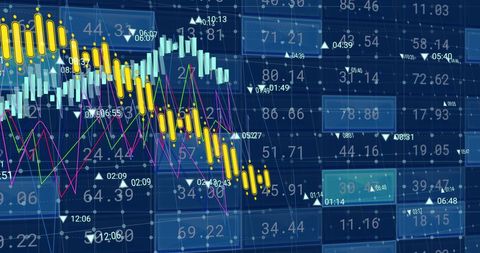
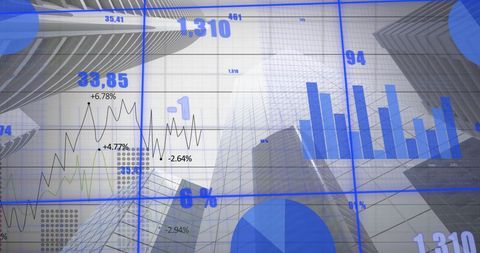
This visual depicts a dynamic display of data processing, featuring various graphs and statistics highlighted by bold red arrows on a deep blue background. The digital interface evokes concepts of global technology and computing. The image is ideal for usage in presentations related to data science, market analysis, or financial reports, bringing a visual emphasis on upward trends and analytical insights in a futuristic, high-tech setting.

Powered by Shutterstock logo - Get 15% off with code: PIKWIZARD15
Displaying bold red downward arrow sloping over dashboard grid lines, bars, golden particle motifs. Data visualization, dashboard, digital interface, futuristic, analytics, data analysis, financial - Powered by Shutterstock - Get 15% off with code: PIKWIZARD15Displaying numeric chart in trading interface, with candlestick, bar, line, pie and arrow elements. Analytics, data visualization, finance, digital interface, investment, market analysis, economic - Powered by Shutterstock - Get 15% off with code: PIKWIZARD15Displaying 3D Earth globe showing data trends in dashboard, with translucent bar charts, red arrow. Data visualization, analytics, financial, technology, digital interface, growth, forecasting - Powered by Shutterstock - Get 15% off with code: PIKWIZARD15Displaying financial chart at digital interface, with blue bars, two line graphs, red decline arrow. Finance, data, analytics, dashboard, technology, investment, digital - Powered by Shutterstock - Get 15% off with code: PIKWIZARD15Displaying ascending blue bars and white line graph with data points on dashboard, with red arrow. Analytics, growth, success, business, digital, progress, performance - Powered by Shutterstock - Get 15% off with code: PIKWIZARD15

Credit Photo

If you would like to credit the Photo, here are some ways you can do so

Free (free of charge)

Free for personal and commercial use.

Author: People Creations

Similar Free Stock Images

Digital Interface with Financial Data Projections
Premium
Image of red arrow with statistics processing over scopes scanning. global business, finances, data processing and digital interface concept digitally generated image.
Digital Financial Data on Futuristic Screen
Data Processing Visual Over Modern Server Room
Dynamic Financial Data Visualization Chart with Trending Lines
Abstract Financial Graphs Displaying Market Trends
Premium
Image of red arrow with statistics processing over cityscape. global business, finances, data processing and digital interface concept digitally generated image.
Digital Data Processing Overlay on Dynamic Cityscape
Dynamic Financial Data Feed with Graphs and Figures
Financial Data Overlay with Business Growth Charts in Modern Cityscape
Abstract Financial Data on Digital Interface Grid Background
Premium
Displaying red arrow slanting downward over blue bars on trading interface, with ticker symbols. Financial, analytics, data visualization, digital, professional, modern, corporate
DNA Strand Overlaying Global Data Patterns
Digital Data Visualization with Graphs and Percentages Overlay
Digital Financial Data Processing on Dark Background
Futuristic Financial Trading Graph and Data Visualization
Premium
Rotating Earth globe showing currency pairs and tickers with line chart over virtual financial data. Global, finance, technology, data visualization, investment, analysis, digital
Futuristic Glowing Digital Interface with Geometric Patterns
Business Data Technology Against Luminous Background
Digital Abstract of Business Growth Charts Over Urban Skyline
Digital Financial Statistics Data Display on Office Background
Premium
Dr in scrubs pressing stethoscope against transparent panel in lab with red line chart and arrow. Medical, technology, diagnostics, analytics, innovation, futuristic, healthcare
Data Processing Overlay on Urban Cityscape with Charts
Digital Financial Data Processing Displayed on Blue Background
Financial Analytics with Dark Grid and Data Visualizations
Digital Data Processing with Global Statistical Analysis
Premium
Displaying red ascending bar chart rising over holographic grid, with virus particle icons. Futuristic, digital, data visualization, holographic, global, analytics, technology
Digital Dashboard Display with Data Visualization and Analytics Graphs
Digital Interface with World Map and Data Analytics Visualization
Futuristic Data Visualization Dashboard with Neon Elements
Digital Dashboard Interface with Analytics and World Map
Abstract Digital Interface with Data and COVID-19 Analysis
Digital Interface Displaying Financial Data Charts and Graphs
Premium
Displaying line chart at trading screen with purple, red-striped arrows marking 73.55 and 50.05. Financial analytics, data visualization, trading interface, investment, digital dashboard
Digital Scope Analyzing Stock Market Data
Dynamic Financial Data on Digital Display Canvas
Innovative Data Processing Over City Skyline
Digital Data Processing and Financial Chart Analysis
Premium
Image of downward red arrow and graphs processing data over landscape. Data, digital interface, business, decline, connection, processing and global communication, digitally generated image.
Abstract Financial Data and Trends Analysis
Data Charts on Transparent Screen in Office Setting
Financial Data Visualization on Digital Grid Backdrop
Global Data Visualization with Spinning Globe
Premium
Large pie chart showing purple red blue segments on dark dashboard with arrows, copy space. Data visualization, financial analytics, digital interface, corporate technology, an​​alytics dashboard,
Futuristic Digital Data Visualizations and Statistics Interface
Global Financial Market Positive Trend Visualization
Futuristic Financial Data Display with Stock Market Analysis
Global Statistical Data and Stock Market Analysis Display
Premium
Featuring wind turbine dominating dashboard, with bar charts, pink line graph, red arrow and gauges. Renewable, sustainability, analytics, technology, futuristic, innovation, measurement
Abstract Digital Financial Data with Global Connections
Financial Growth Analytics Overlay on Skyscrapers
Digital Data Stream with Binary Code and Charts
Abstract Digital Data Exchange Over Server Unit Background
Premium
Displaying holographic grids with padlock icon floating over virtual interface, with data panels. Futuristic, technology, digital, interface, security, data visualization, cyber
Global Finance Data Processing with World Map Visualization
Global Financial Data Analytics with Abstract Digital Concept
Digital Data Visualization on Grid Background
Dynamic Financial Data on Digital Screen with Processing Concepts
Premium
Showing green trend line over white grid on screen, with numeric labels, ticks, red downward arrow. Analytics, finance, bar chart, bar graph, data visualization, dashboard, infographic
Futuristic Digital Analytics Dashboard Display with Data Visualization
Global Financial Data Visualization with Charts and World Map
Blue Data Dashboard Displaying Chat Notification 95 Over Analytics, Bar and Pie Charts
Financial Analytics with Graphs and Data on Digital Interface
Futuristic Digital Interface with Data and QR Code Overlay
Digital Data Footprint with 6G Network Technology Concept
Premium
Image of red arrow with statistics processing over scopes scanning. global business, finances, data processing and digital interface concept digitally generated image.
Digital Data Processing with Percentage Symbols and Numeric Codes
Digital Financial Data Visualizations with Abstract Green Waves
Digital Analytics Financial Market Interface Visualization
Abstract Data Processing Dashboard with Digital Graphs
Premium
Red arrow up, Business Process Data Analysis concept
Digital Financial Data and Cyber Technology Concept
Financial Data Analysis Over Dynamic Digital Interface
Digitally Generated DNA Strand with Data Processing Elements
Futuristic Data Interface with Dynamic Charts and Diagrams
Premium
Image of red arrow with statistics processing over man using laptop. global communication, connections, technology and digital interface concept digitally generated image.
Futuristic Digital Network with Connected Data Patterns
Financial Data Analytics with Cityscape Background Overlay
Financial Data Processing with Digital Graphs and Numbers
Digital Hologram of Graphs and Data Icons on Abstract Background
Premium
Hands typing on laptop with glowing financial bar graphs and red trend lines overlayed, concept of business analytics and data analysis in finance
Blue Business Analytics Overlay on Urban Skyline
Futuristic Data Analysis and Global Networking Interface
Financial Data Analysis with Line Graph and Chart Overlays
Analyzing Data Graphs in Digital Network Environment
Premium
Presenting trading interface with bar chart, line graph, arrow and red green ticker, copy space. Finance, data visualization, analytics, digital, technology, investment, business
Global Data Analytics Visualization with Rotating Earth
Abstract Financial Data Chart with Circles and Bar Graphs
Financial Trading Dashboard with Candlestick and Line Graphs
Interactive Digital Dashboard Displaying Analytics and Social Metrics
Premium
Kicking high soccer player wearing jersey number 14, cleats on grid showing HUD, copy space. Athlete, sports, motion, futuristic, digital, analysis, competition
Dynamic Data Dashboard with Global Analytics Visualization
Blue Data Visualization Overlaying Hazy Urban Harbor Skyline, Futuristic Analytics Interface
Financial Data Visualization in Blue with Dynamic Graphics
Global Connectivity in Data and Financial Markets Conceptual Design
Digital Stock Market Data and Statistical Analysis Background
Dynamic Stock Market Analytics with High-Tech Data Visualization
Premium
Image of red arrow with statistics processing over scopes scanning. global business, finances, data processing and digital interface concept digitally generated image.
Abstract Digital Data Interface with Blue Background
Data Visualization Overlay with Business Analytics Elements
Futuristic Financial Data Processing in Digital Interface
Global Financial Data Interface with World Map Background
Premium
Pointing bold red arrow moving upward across virtual dashboard, with bar charts and ticker panels. Finance, analytics, technology, investment, data, charting, digital
Digital Financial Data Grid Visualizing Economic Analysis
Statistical Data Overlay on Urban Cityscape with Grid Network
Global Statistical Analysis with Interactive Digital Display
Digital Graphs and Statistics Interface on Blue Grid
Premium
Red-pink 3D bar chart descending with white-dotted arrow in data interface, with viral spheres. Data visualization, scientific graphics, digital infographics, high-tech interface, analytical tools,
Global Stock Market Data Visualization on World Map Background
Digital Icons and Data with Cyber Security Concept
Digital Stock Market Chart with Colorful Finance Data Visuals
Digital Financial Growth Concepts over Urban Landscape
Premium
Middle-aged man wearing plaid shirt analyzing line chart overlay in office, with arrow icons. Data visualization, business analytics, corporate, technology, financial, modern workspace, analysis
Global Data Network with Dynamic Graph Connections
Financial Data Visualization with Dynamic Graphical Analysis
Dynamic Digital Stock Market Data on Grid Background
Digital Interface with Data Processing Diagrams and Graphs
Premium
Increasing red arrow graph with business data report with growth profit and virtual interface in digital tablet computer.Business growing,Digital marketing technology and global Successful busines
Financial Data Visualization with Bars and Pie Charts
Futuristic Data Dashboard with Holographic Interface Design
Digital Analytics Dashboard Displaying Interactive Data Charts
Business Analyst Interacting with Augmented Reality Data Visualizations
Premium
Displaying financial chart with jagged red line 50.03 label on monitor, with blue and purple arrows. Finance, data visualization, analytics, digital dashboard, stock market, investment, technology
Futuristic Blue Data Dashboard Displaying Bar Chart and Percentage Metrics