- Home >
- Stock Photos >
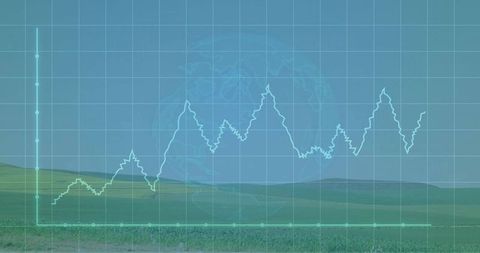
- Digital Data Analysis Interface with Graphs and Scope
Digital Data Analysis Interface with Graphs and Scope Image

Futuristic digital interface with scope for analyzing data visualizations. Displays graphs to indicate data trends and percentages. Enhances business presentations, tech demonstrations, financial analysis tools, and digital marketing content.

downloads
Tags:
More
Credit Photo
If you would like to credit the Photo, here are some ways you can do so
Text Link
photo Link
<span class="text-link">
<span>
<a target="_blank" href=https://pikwizard.com/photo/digital-data-analysis-interface-with-graphs-and-scope/ee2eafe523dd4e1b7e1496fb84fe7d64/>PikWizard</a>
</span>
</span>
<span class="image-link">
<span
style="margin: 0 0 20px 0; display: inline-block; vertical-align: middle; width: 100%;"
>
<a
target="_blank"
href="https://pikwizard.com/photo/digital-data-analysis-interface-with-graphs-and-scope/ee2eafe523dd4e1b7e1496fb84fe7d64/"
style="text-decoration: none; font-size: 10px; margin: 0;"
>
<img src="https://pikwizard.com/pw/medium/ee2eafe523dd4e1b7e1496fb84fe7d64.jpg" style="margin: 0; width: 100%;" alt="" />
<p style="font-size: 12px; margin: 0;">PikWizard</p>
</a>
</span>
</span>
Free (free of charge)
Free for personal and commercial use.
Author: Awesome Content