
- Home >
- Stock Photos >
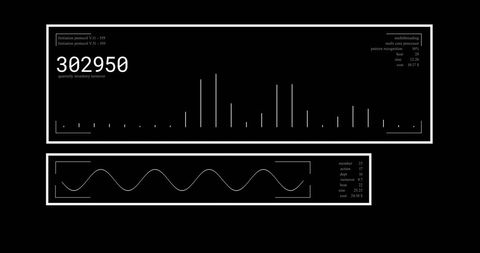
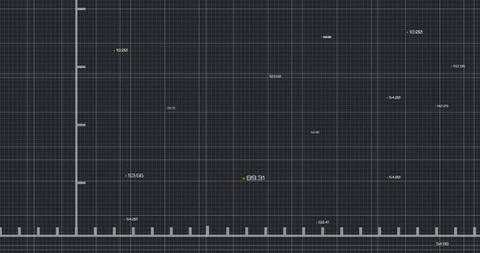
- Digital Data Analysis on Blue Grid Background with Graphs
Digital Data Analysis on Blue Grid Background with Graphs Image

This image creatively depicts digital data analysis with graphs over a blue grid background. The white outlines and numbers suggest computing and data processing concepts. Useable for articles, marketing material related to technology, computing, data science, or cybersecurity industries to visually enhance content on digital transformation or data-driven solutions.
Powered by 


downloads
Tags:
More
Credit Photo
If you would like to credit the Photo, here are some ways you can do so
Text Link
photo Link
<span class="text-link">
<span>
<a target="_blank" href=https://pikwizard.com/photo/digital-data-analysis-on-blue-grid-background-with-graphs/c6b3043fce52c0dc4952cceff07e8ba1/>PikWizard</a>
</span>
</span>
<span class="image-link">
<span
style="margin: 0 0 20px 0; display: inline-block; vertical-align: middle; width: 100%;"
>
<a
target="_blank"
href="https://pikwizard.com/photo/digital-data-analysis-on-blue-grid-background-with-graphs/c6b3043fce52c0dc4952cceff07e8ba1/"
style="text-decoration: none; font-size: 10px; margin: 0;"
>
<img src="https://pikwizard.com/pw/medium/c6b3043fce52c0dc4952cceff07e8ba1.jpg" style="margin: 0; width: 100%;" alt="" />
<p style="font-size: 12px; margin: 0;">PikWizard</p>
</a>
</span>
</span>
Free (free of charge)
Free for personal and commercial use.
Author: People Creations
Similar Free Stock Images

Premium


Premium

Premium


Premium


Premium


Premium


Premium

Premium

Premium

Premium


Premium


Premium


Premium


Premium


Premium


Premium


Premium


Premium


Premium

Premium


Premium


Premium


Premium

Premium


Premium


Explore More Free Stock Images