
- Home >
- Stock Photos >
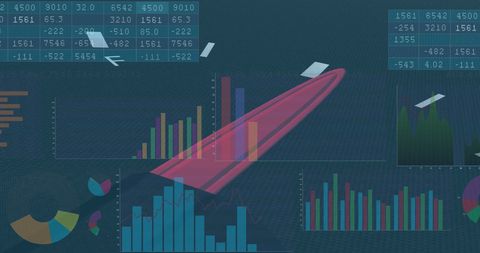
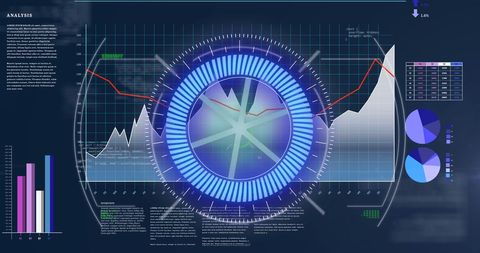
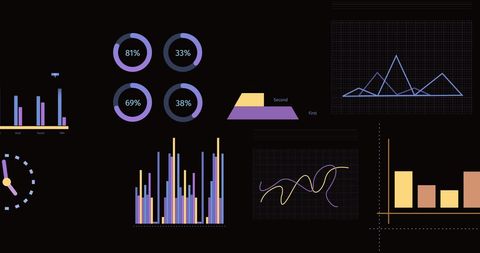
- Digital Data Analysis on Digital Interface With Graphs
Digital Data Analysis on Digital Interface With Graphs Image
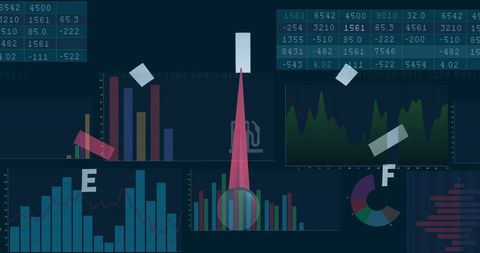
Visual depicts infographics being displayed on a digital screen, exploring innovative data solutions in business and finance. It includes a variety of graphical representations such as bar charts and line graphs, illustrating financial metrics. Useful for presentations, educational materials, or articles discussing data analysis, finance and technology advancements.
Powered by 


downloads
Tags:
More
Credit Photo
If you would like to credit the Photo, here are some ways you can do so
Text Link
photo Link
<span class="text-link">
<span>
<a target="_blank" href=https://pikwizard.com/photo/digital-data-analysis-on-digital-interface-with-graphs/a5135217e26a3e1d165fd0f40add721c/>PikWizard</a>
</span>
</span>
<span class="image-link">
<span
style="margin: 0 0 20px 0; display: inline-block; vertical-align: middle; width: 100%;"
>
<a
target="_blank"
href="https://pikwizard.com/photo/digital-data-analysis-on-digital-interface-with-graphs/a5135217e26a3e1d165fd0f40add721c/"
style="text-decoration: none; font-size: 10px; margin: 0;"
>
<img src="https://pikwizard.com/pw/medium/a5135217e26a3e1d165fd0f40add721c.jpg" style="margin: 0; width: 100%;" alt="" />
<p style="font-size: 12px; margin: 0;">PikWizard</p>
</a>
</span>
</span>
Free (free of charge)
Free for personal and commercial use.
Author: Creative Art
Similar Free Stock Images

Premium


Premium


Premium


Premium


Premium


Premium


Premium


Premium

Premium


Premium

Premium


Premium


Premium


Premium

Premium


Premium


Premium


Premium


Premium


Premium

Premium

Premium


Premium


Premium


Premium


Explore More Free Stock Images