- Home >
- Stock Photos >
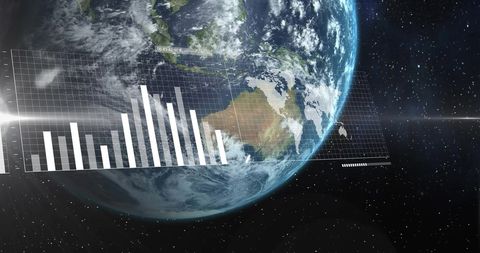
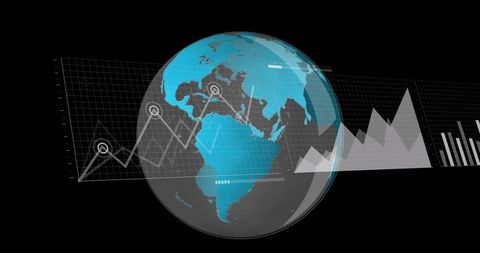
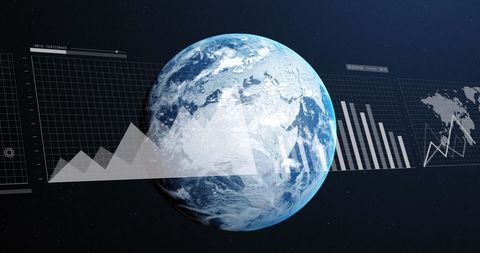
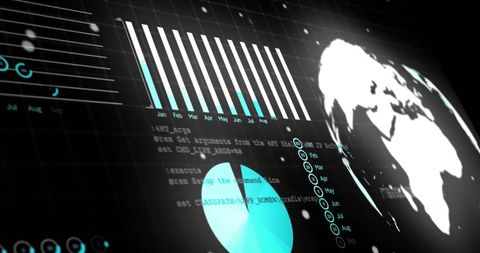
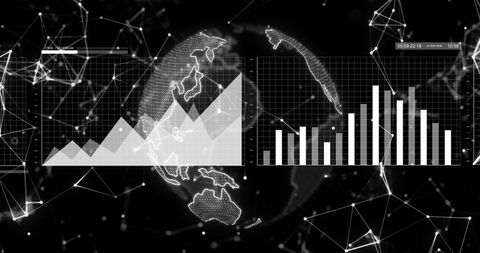
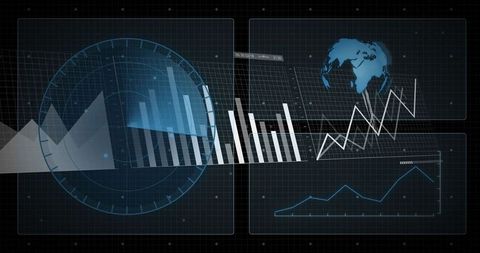
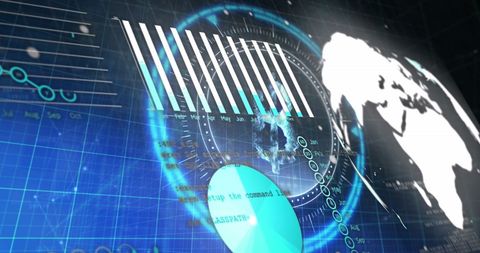
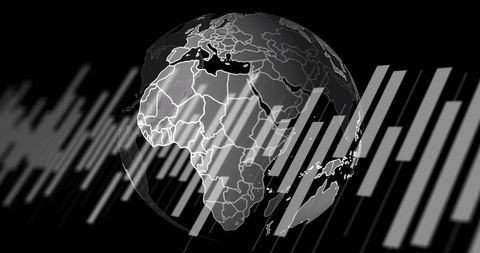
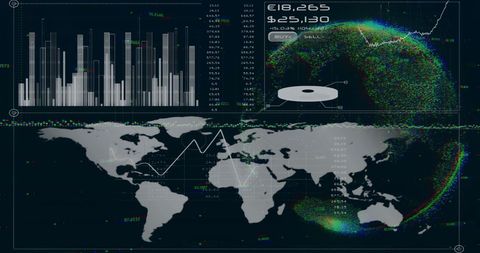
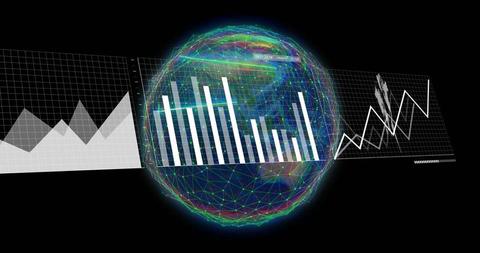
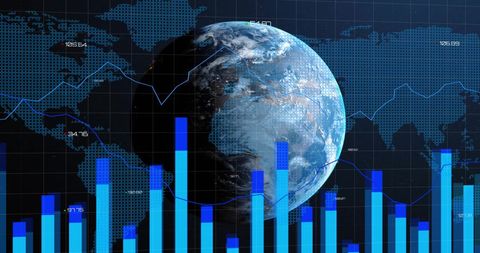
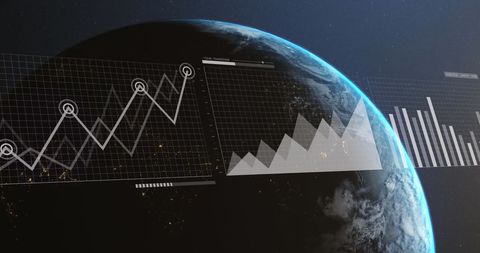
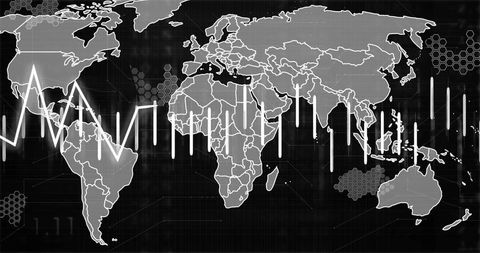
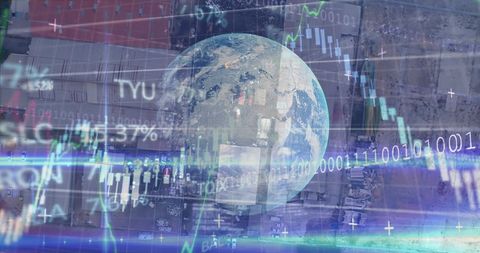
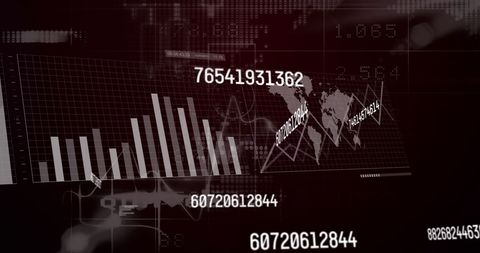
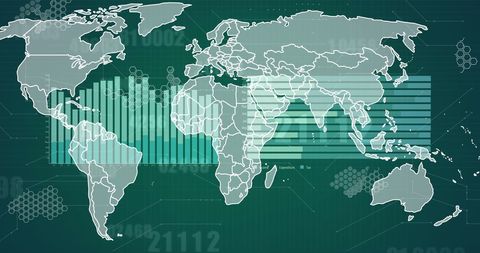
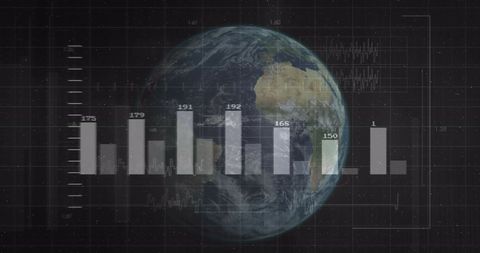
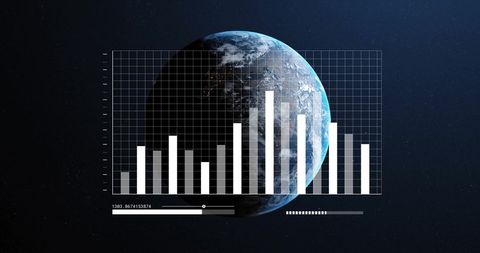
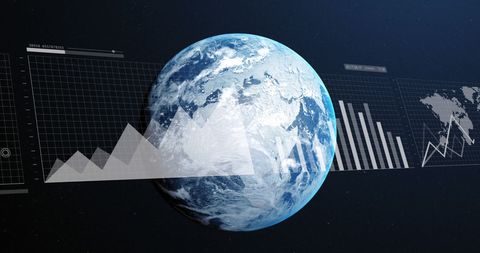
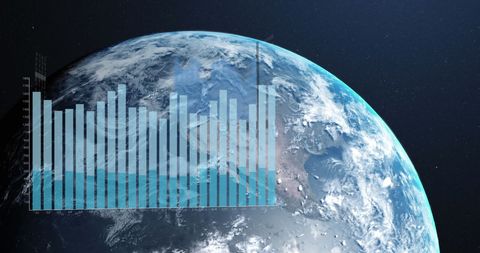
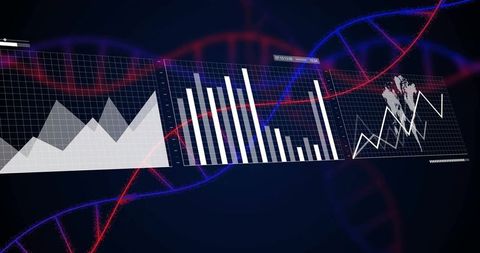
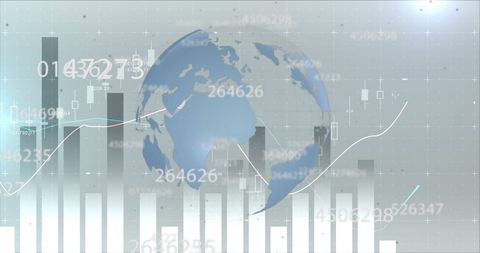
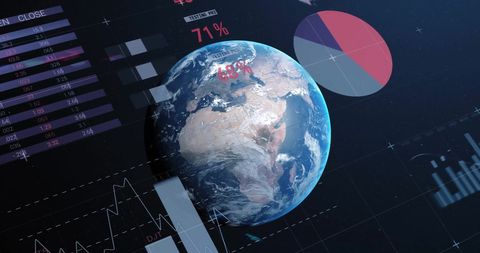
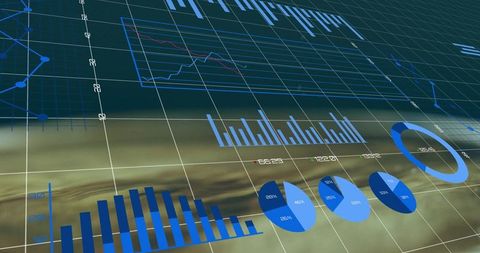
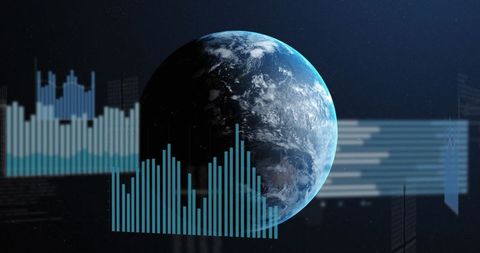
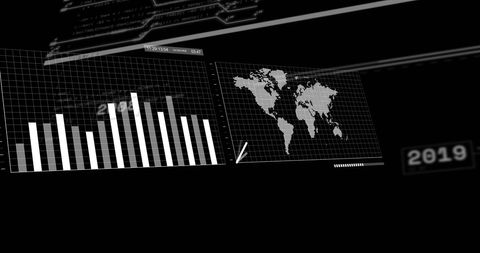
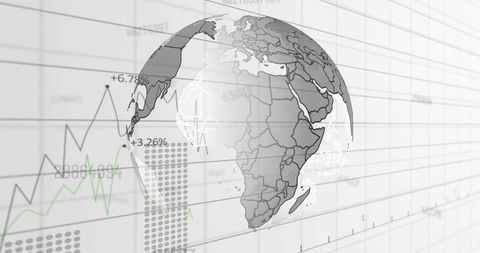
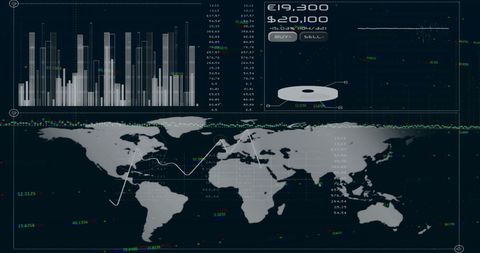
- Digital Data Analysis on Global Map with Graphs and Computations
Digital Data Analysis on Global Map with Graphs and Computations Image
This futuristic design illustrates global data analysis with bar charts and digital mapping. It is ideal for use in presentations about trends in technology, computing, and finance. Suitable for articles on global markets, cybersecurity, and data science, showcasing advanced technology concepts.

downloads
Tags:
More
Credit Photo
If you would like to credit the Photo, here are some ways you can do so
Text Link
photo Link
<span class="text-link">
<span>
<a target="_blank" href=https://pikwizard.com/photo/digital-data-analysis-on-global-map-with-graphs-and-computations/76104b447bb0605bca4e829679cbf2d0/>PikWizard</a>
</span>
</span>
<span class="image-link">
<span
style="margin: 0 0 20px 0; display: inline-block; vertical-align: middle; width: 100%;"
>
<a
target="_blank"
href="https://pikwizard.com/photo/digital-data-analysis-on-global-map-with-graphs-and-computations/76104b447bb0605bca4e829679cbf2d0/"
style="text-decoration: none; font-size: 10px; margin: 0;"
>
<img src="https://pikwizard.com/pw/medium/76104b447bb0605bca4e829679cbf2d0.jpg" style="margin: 0; width: 100%;" alt="" />
<p style="font-size: 12px; margin: 0;">PikWizard</p>
</a>
</span>
</span>
Free (free of charge)
Free for personal and commercial use.
Author: People Creations