- Home >
- Stock Photos >
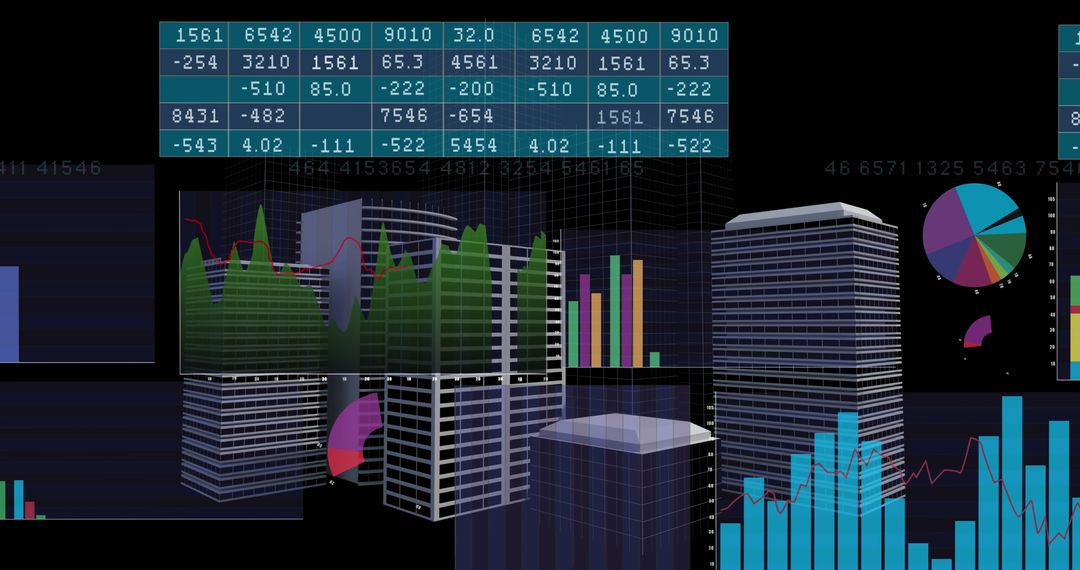
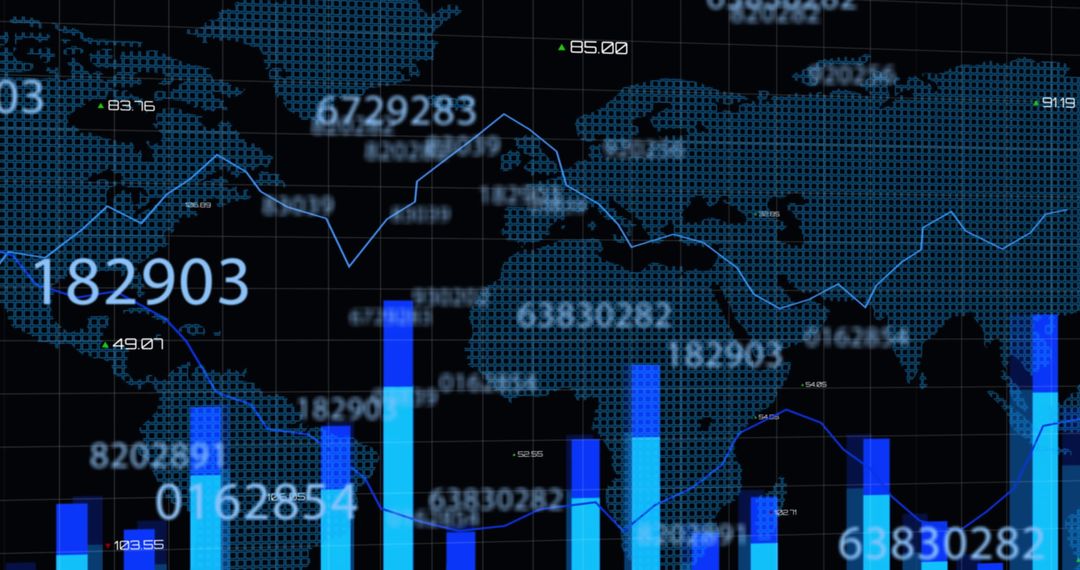
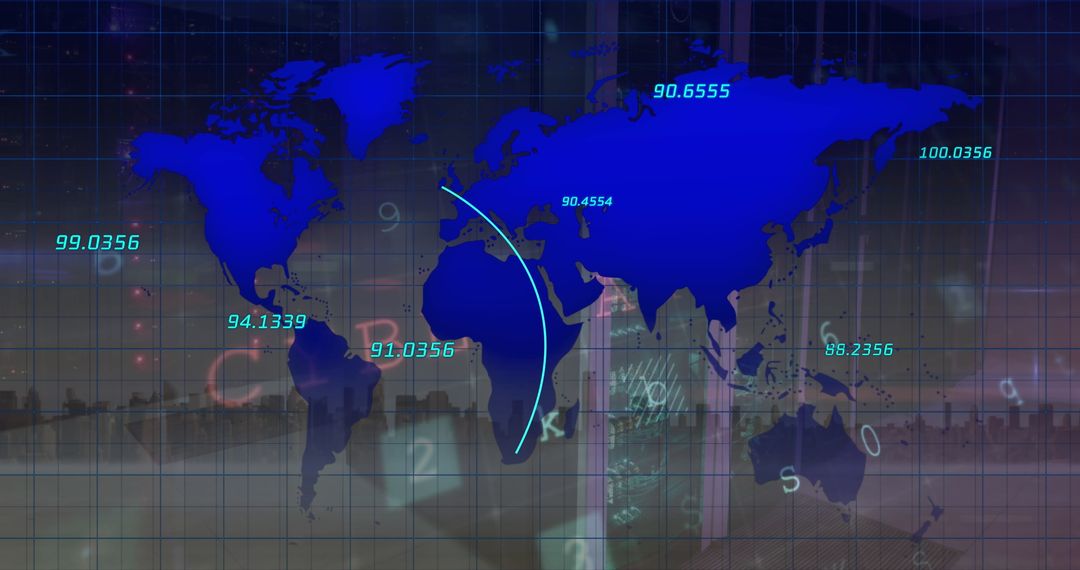
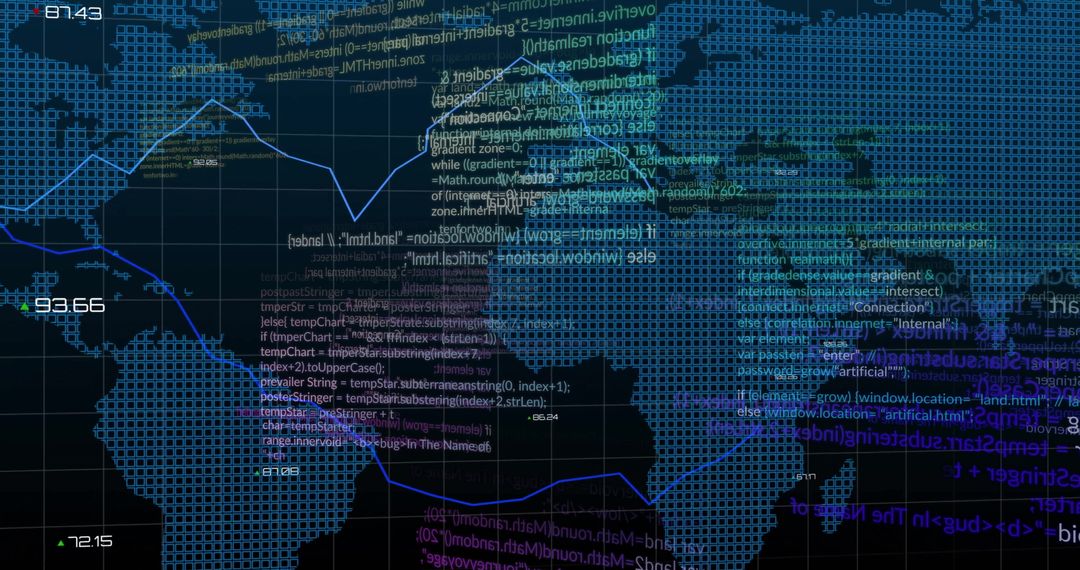
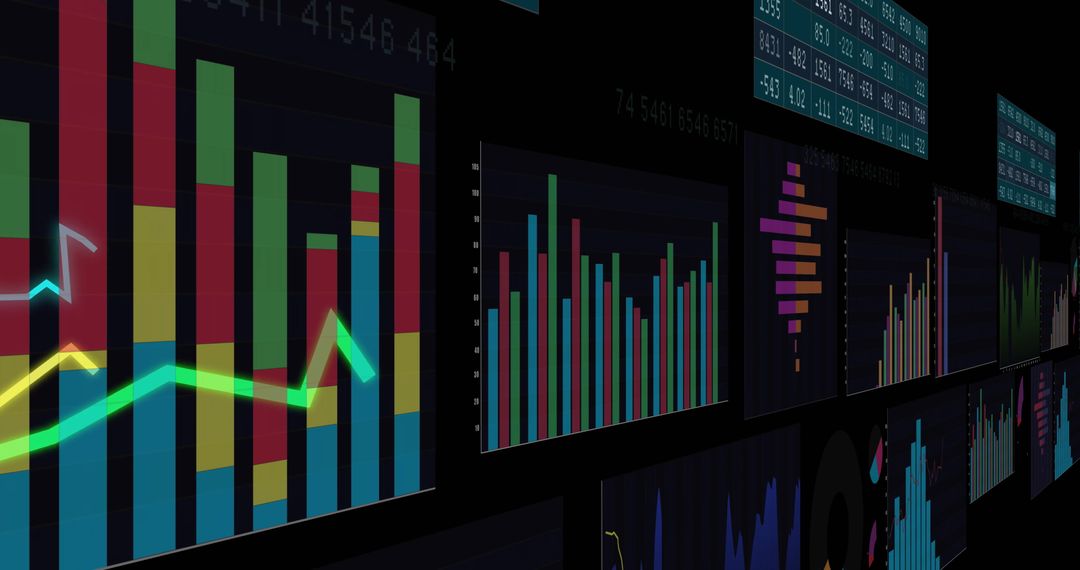
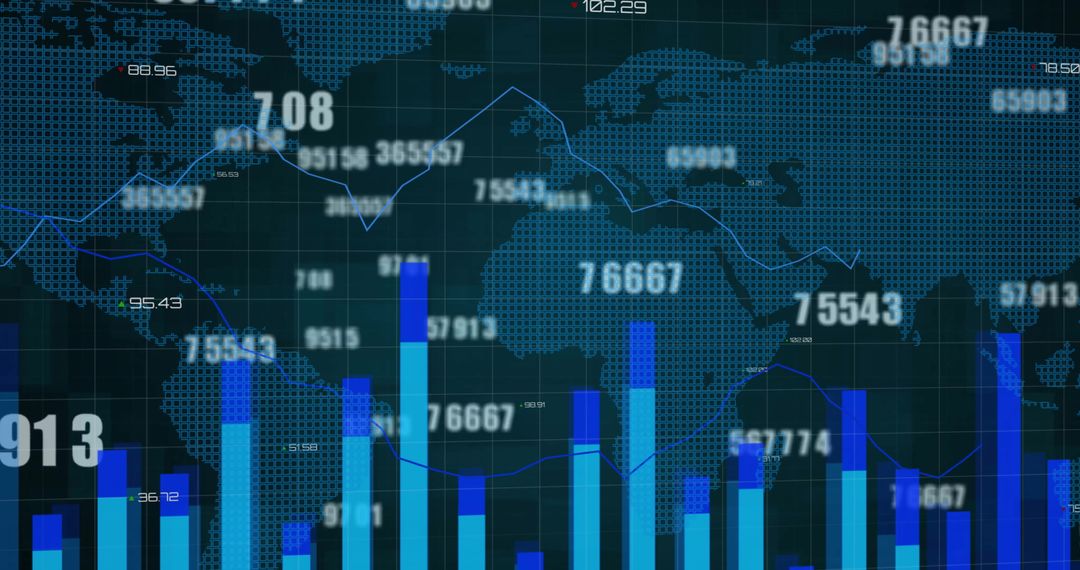
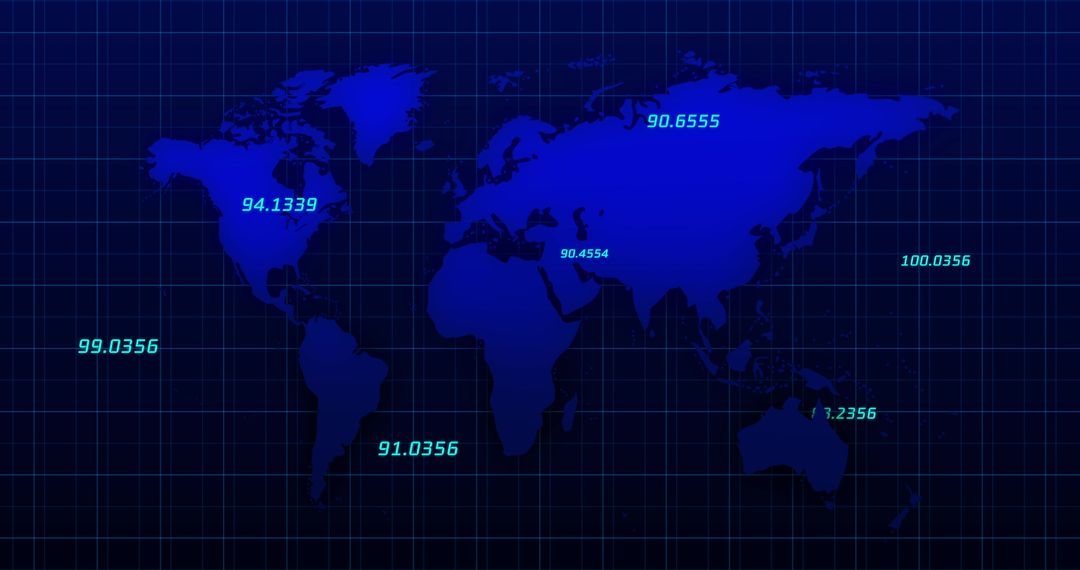
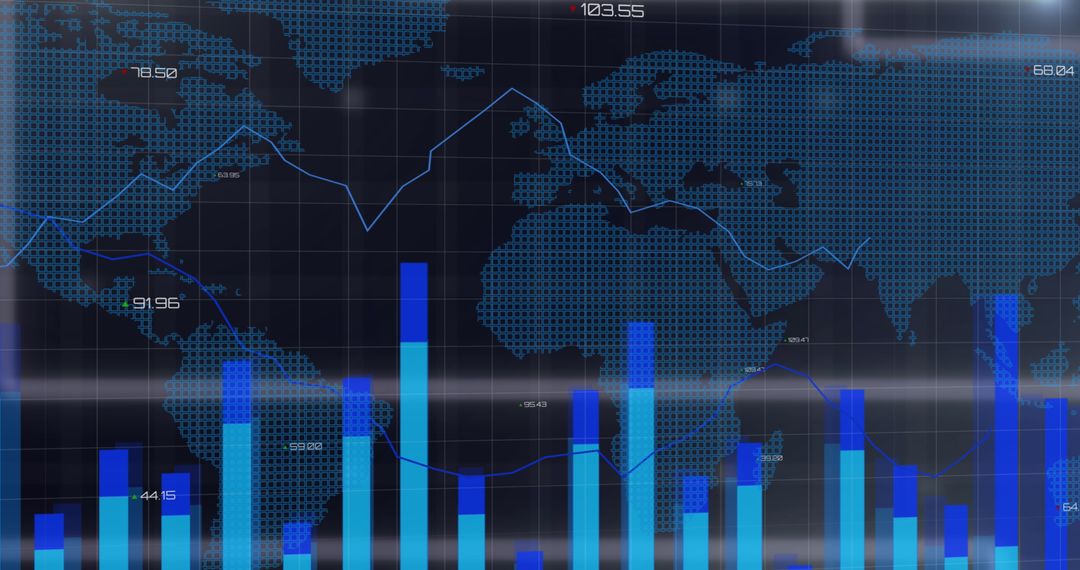
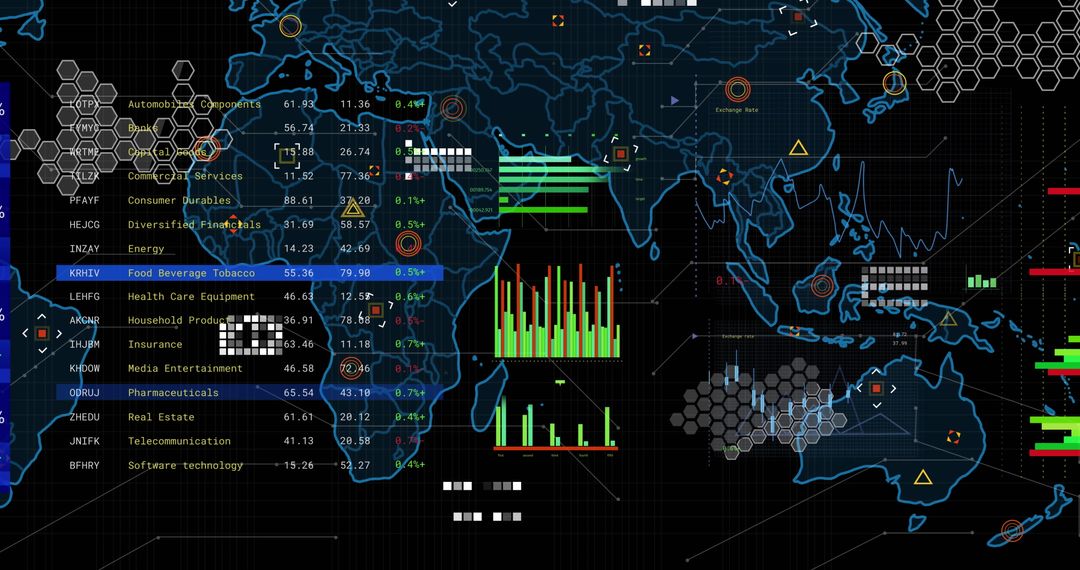
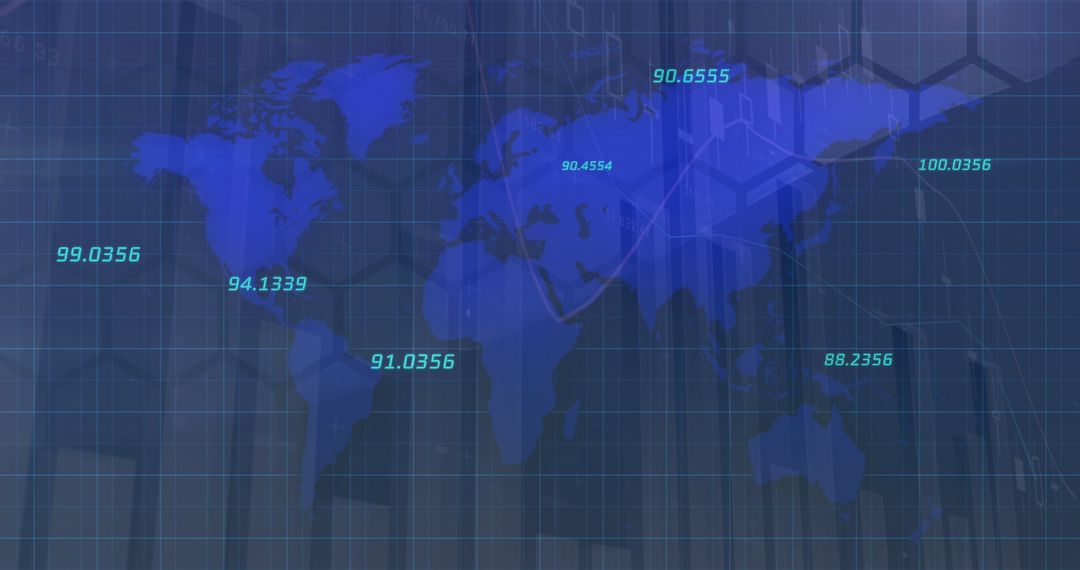
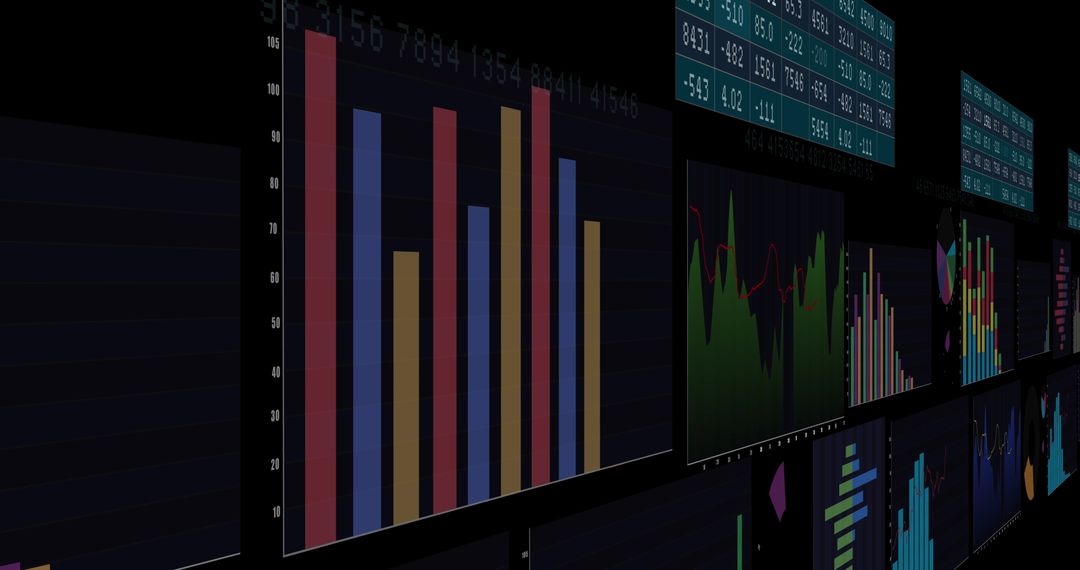
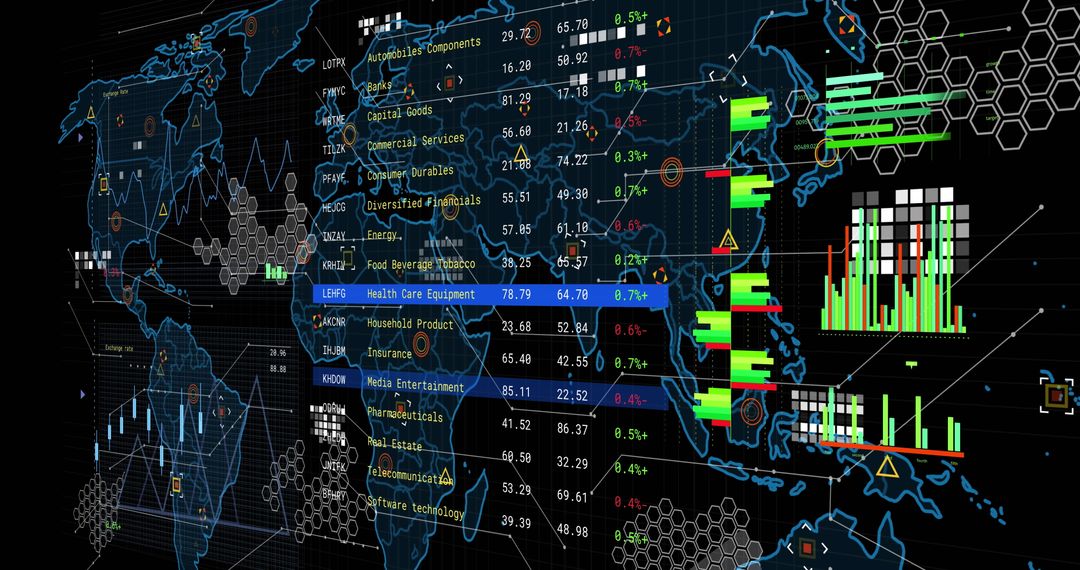
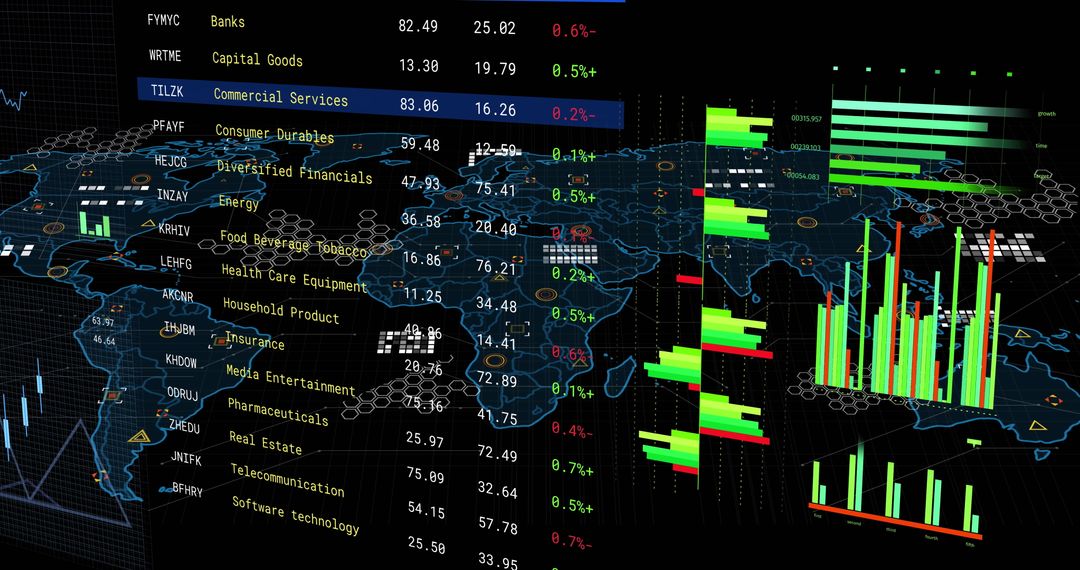
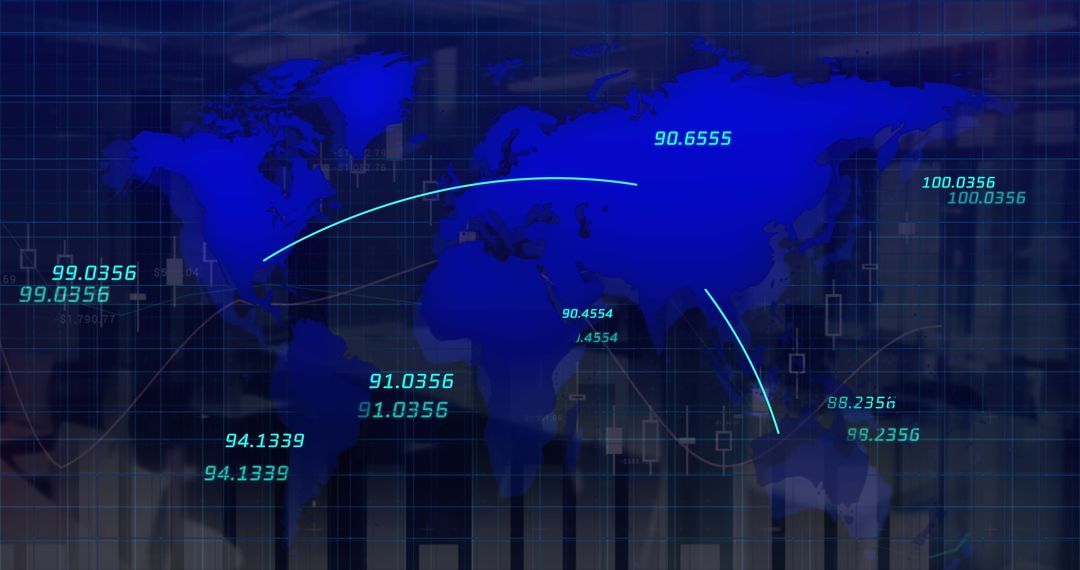
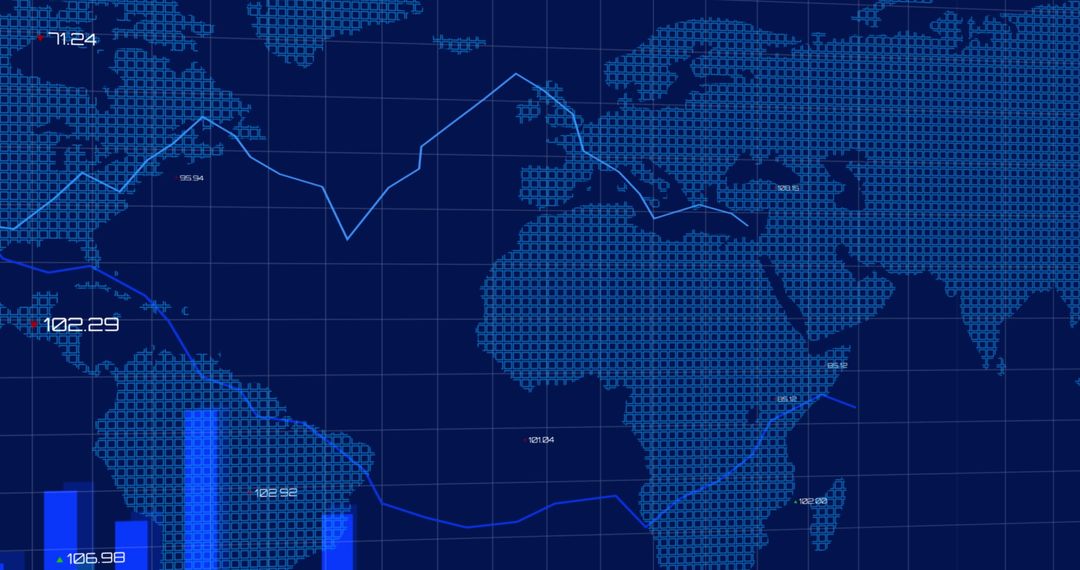
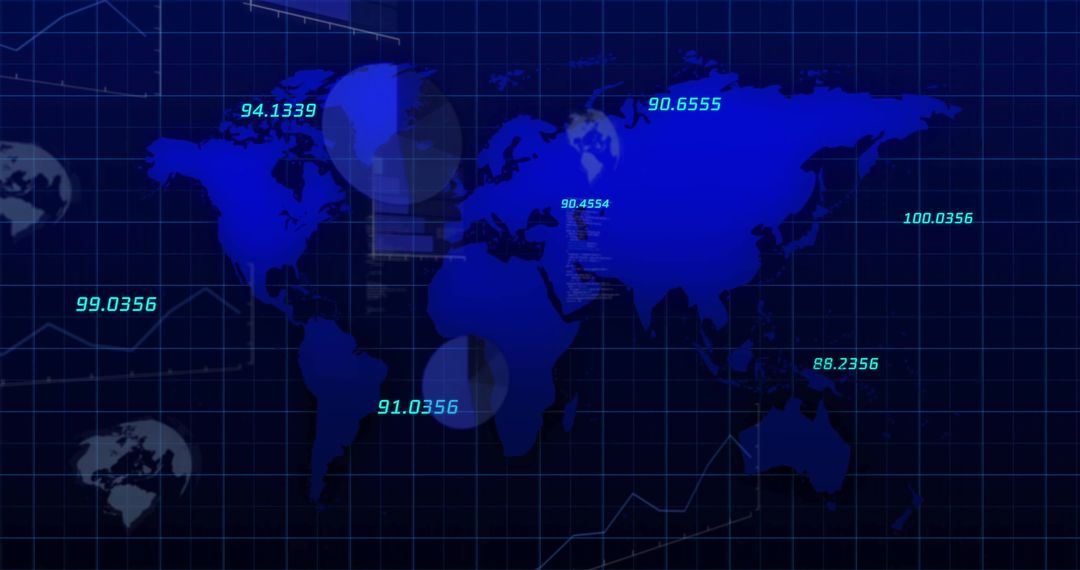
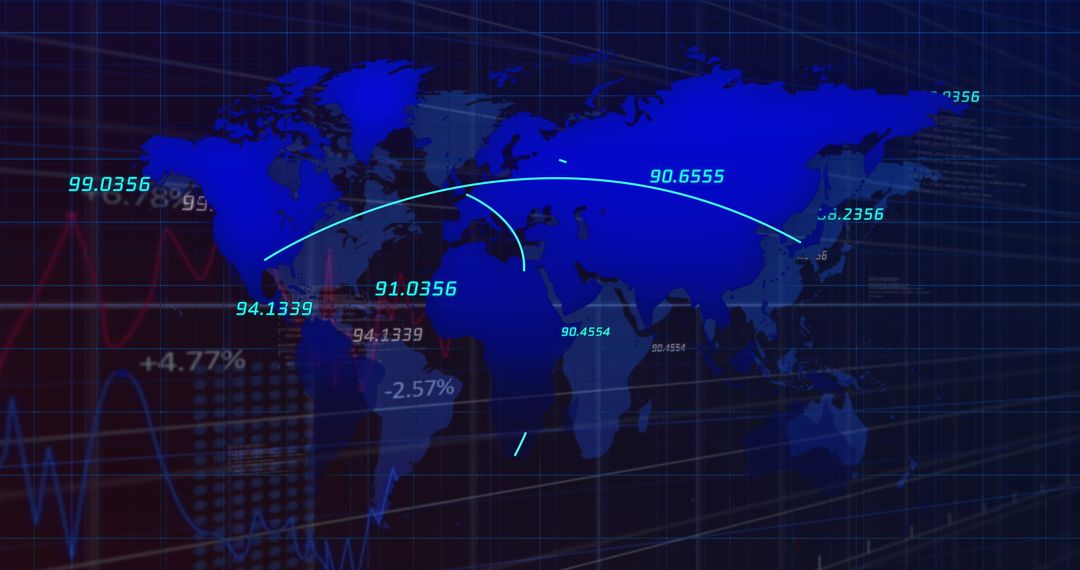
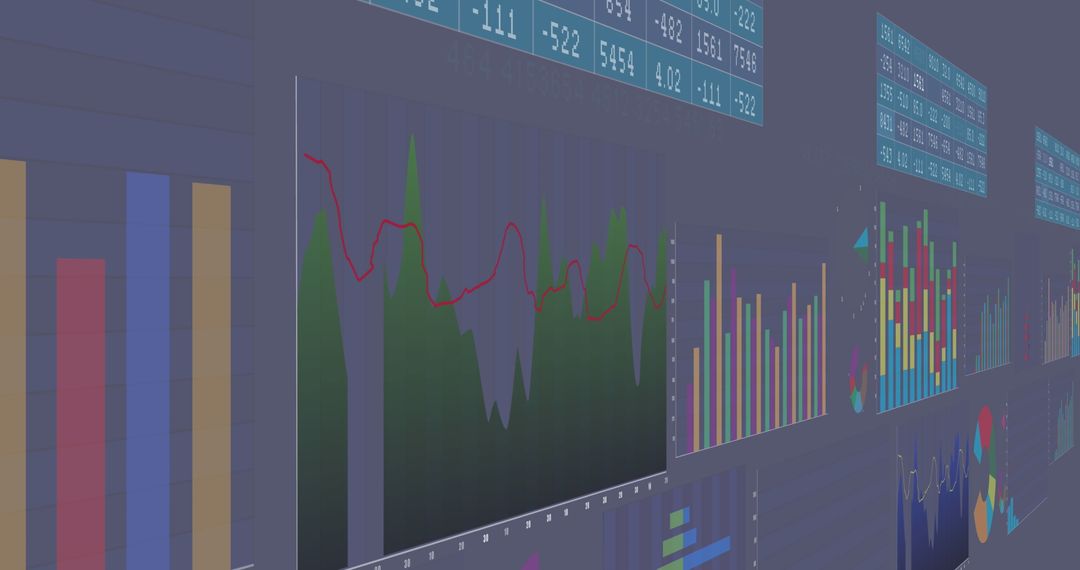
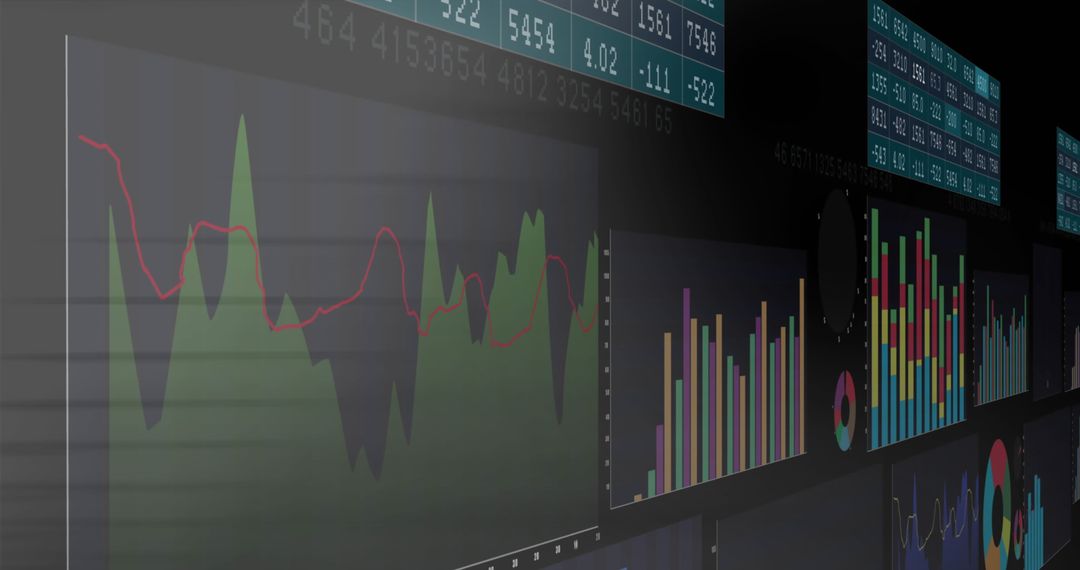
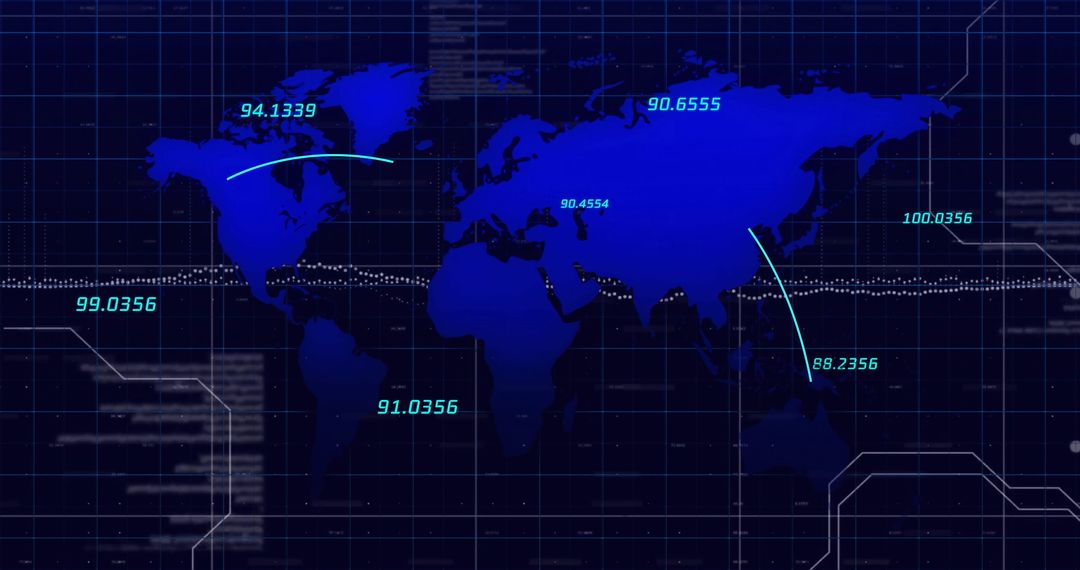
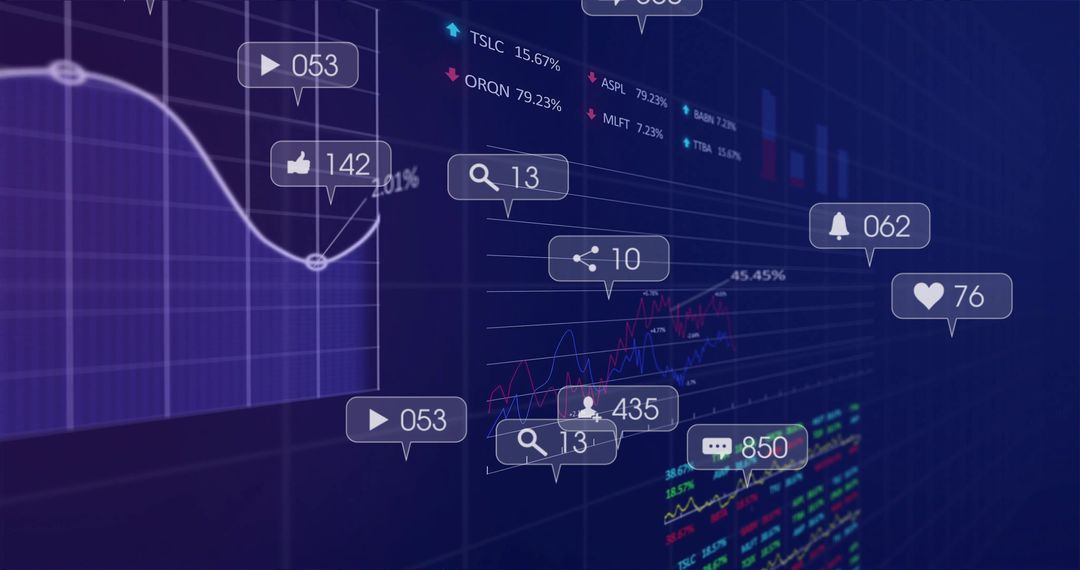
- Digital Data Analysis Over World Map Illustrating Global Connections
Digital Data Analysis Over World Map Illustrating Global Connections Image

Illustration showing various charts and graphs, symbolizing digital data processing and analysis overlaid on a subtle world map. This representation is ideal for projects related to financial markets, global communications, technology developments, and big data analytics. Useful for infographics, presentations on global economy or data-centric discussions.
Powered by 


0
downloads
downloads
Tags:
More
Credit Photo
If you would like to credit the Photo, here are some ways you can do so
Text Link
photo Link
<span class="text-link">
<span>
<a target="_blank" href=https://pikwizard.com/photo/digital-data-analysis-over-world-map-illustrating-global-connections/12911b491a7743442bb455678d5744a3/>PikWizard</a>
</span>
</span>
<span class="image-link">
<span
style="margin: 0 0 20px 0; display: inline-block; vertical-align: middle; width: 100%;"
>
<a
target="_blank"
href="https://pikwizard.com/photo/digital-data-analysis-over-world-map-illustrating-global-connections/12911b491a7743442bb455678d5744a3/"
style="text-decoration: none; font-size: 10px; margin: 0;"
>
<img src="https://pikwizard.com/pw/medium/12911b491a7743442bb455678d5744a3.jpg" style="margin: 0; width: 100%;" alt="" />
<p style="font-size: 12px; margin: 0;">PikWizard</p>
</a>
</span>
</span>
Free (free of charge)
Free for personal and commercial use.
Author: People Creations
Similar Free Stock Images

Premium


Premium


Premium


Premium


Premium


Premium


Premium


Premium


Premium


Premium


Premium


Premium


Premium


Premium


Premium


Premium


Premium


Premium


Premium


Premium


Premium


Premium


Premium


Premium