
- Home >
- Stock Photos >
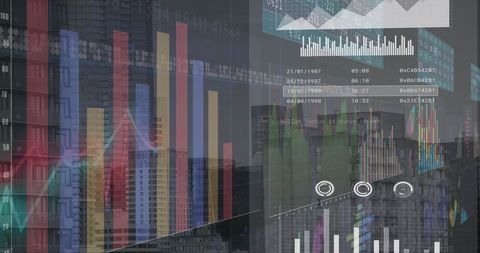
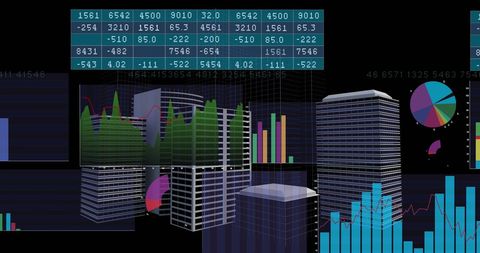
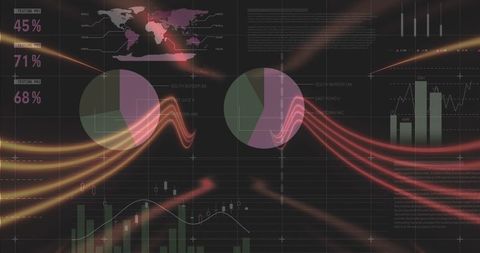
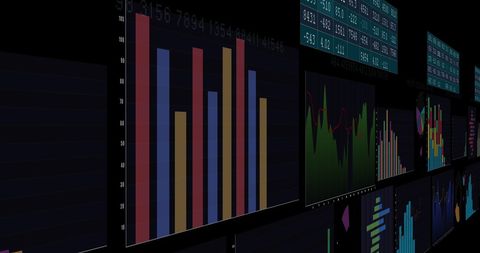
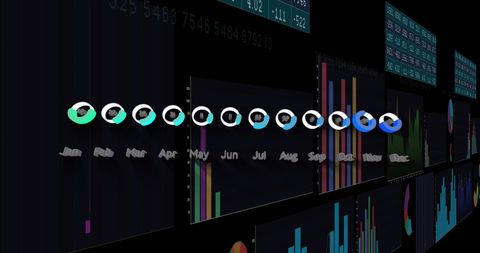
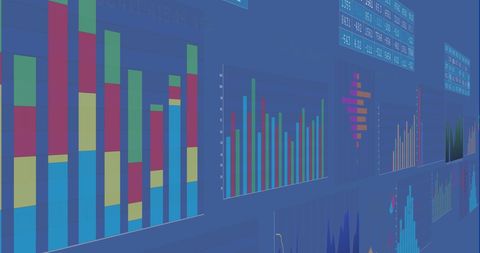
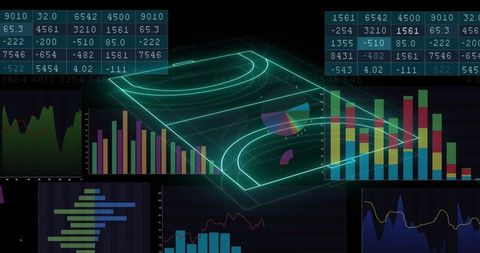
- Digital Data Analysis Screens with Interactive Charts and Graphs
Digital Data Analysis Screens with Interactive Charts and Graphs Image
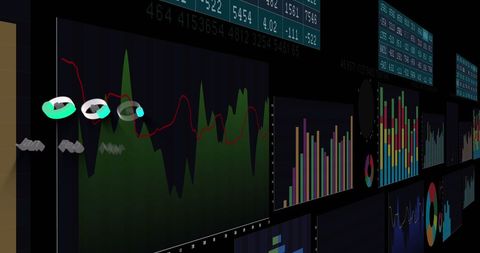
This digital depiction of multiple screens features a variety of graphs and charts showcasing complex data analysis. Various graph formats, including line and bar graphs, cater to the needs of financial and analytics professionals. Useful for technology studies, data research contexts, business analytics depictions, and reports emphasizing data-driven decision-making.
Powered by  - Get 15% off with code: PIKWIZARD15


downloads
Tags:
More
Credit Photo
If you would like to credit the Photo, here are some ways you can do so
Text Link
photo Link
<span class="text-link">
<span>
<a target="_blank" href=https://pikwizard.com/photo/digital-data-analysis-screens-with-interactive-charts-and-graphs/bcd8f7e6f0d392cd86c58320609fe88e/>PikWizard</a>
</span>
</span>
<span class="image-link">
<span
style="margin: 0 0 20px 0; display: inline-block; vertical-align: middle; width: 100%;"
>
<a
target="_blank"
href="https://pikwizard.com/photo/digital-data-analysis-screens-with-interactive-charts-and-graphs/bcd8f7e6f0d392cd86c58320609fe88e/"
style="text-decoration: none; font-size: 10px; margin: 0;"
>
<img src="https://pikwizard.com/pw/medium/bcd8f7e6f0d392cd86c58320609fe88e.jpg" style="margin: 0; width: 100%;" alt="" />
<p style="font-size: 12px; margin: 0;">PikWizard</p>
</a>
</span>
</span>
Free (free of charge)
Free for personal and commercial use.
Author: Authentic Images
Similar Free Stock Images

Premium


Premium

Premium


Premium

Premium


Premium


Premium

Premium


Premium


Premium

Premium


Premium


Premium

Premium


Premium


Premium


Premium


Premium


Premium

Premium


Premium

Premium


Premium


Premium


Premium


Explore More Free Stock Images