
- Home >
- Stock Photos >
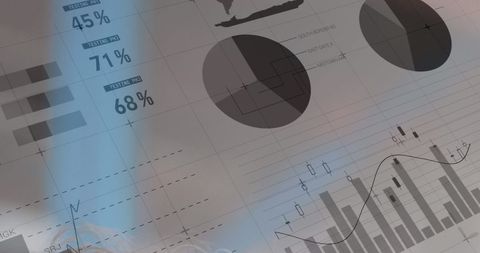
- Digital Data Analysis Visualization with Graphs and Charts
Digital Data Analysis Visualization with Graphs and Charts Image

This image illustrates a digital interface showcasing various graphs, charts, and statistical data, useful for illustrating concepts related to business analytics, data processing, or financial analysis. Ideal for presentations, articles, or websites focused on interpreting data in technological or corporate settings.
Powered by 


downloads
Tags:
More
Credit Photo
If you would like to credit the Photo, here are some ways you can do so
Text Link
photo Link
<span class="text-link">
<span>
<a target="_blank" href=https://pikwizard.com/photo/digital-data-analysis-visualization-with-graphs-and-charts/9708399a277e0d6f3510e9509e40690f/>PikWizard</a>
</span>
</span>
<span class="image-link">
<span
style="margin: 0 0 20px 0; display: inline-block; vertical-align: middle; width: 100%;"
>
<a
target="_blank"
href="https://pikwizard.com/photo/digital-data-analysis-visualization-with-graphs-and-charts/9708399a277e0d6f3510e9509e40690f/"
style="text-decoration: none; font-size: 10px; margin: 0;"
>
<img src="https://pikwizard.com/pw/medium/9708399a277e0d6f3510e9509e40690f.jpg" style="margin: 0; width: 100%;" alt="" />
<p style="font-size: 12px; margin: 0;">PikWizard</p>
</a>
</span>
</span>
Free (free of charge)
Free for personal and commercial use.
Author: Awesome Content
Similar Free Stock Images

Premium


Premium


Premium


Premium


Premium


Premium

Premium


Premium


Premium

Premium

Premium


Premium


Premium


Premium


Premium

Premium


Premium


Premium


Premium

Premium


Premium


Premium


Premium


Premium


Premium

Explore More Free Stock Images