
- Home >
- Stock Photos >
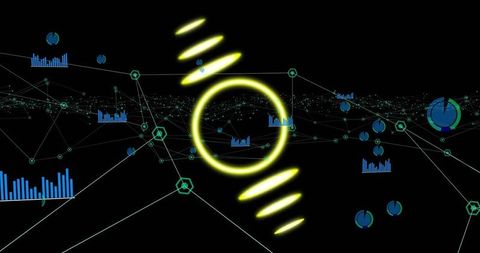
- Digital Data Analysis with Circular Graph and Statistics
Digital Data Analysis with Circular Graph and Statistics Image

Illustrates data analytics with circular graph displaying numbers and lines interconnected. Apt for presentations about data science, business intelligence, and statistical analysis. Useful in presenting complex information visually in enterprises, educational materials, and technology-related content.
Powered by  - Get 15% off with code: PIKWIZARD15


downloads
Tags:
More
Credit Photo
If you would like to credit the Photo, here are some ways you can do so
Text Link
photo Link
<span class="text-link">
<span>
<a target="_blank" href=https://pikwizard.com/photo/digital-data-analysis-with-circular-graph-and-statistics/b5775ffc932ff9eb2d09e31575cc6c00/>PikWizard</a>
</span>
</span>
<span class="image-link">
<span
style="margin: 0 0 20px 0; display: inline-block; vertical-align: middle; width: 100%;"
>
<a
target="_blank"
href="https://pikwizard.com/photo/digital-data-analysis-with-circular-graph-and-statistics/b5775ffc932ff9eb2d09e31575cc6c00/"
style="text-decoration: none; font-size: 10px; margin: 0;"
>
<img src="https://pikwizard.com/pw/medium/b5775ffc932ff9eb2d09e31575cc6c00.jpg" style="margin: 0; width: 100%;" alt="" />
<p style="font-size: 12px; margin: 0;">PikWizard</p>
</a>
</span>
</span>
Free (free of charge)
Free for personal and commercial use.
Author: Creative Art
Similar Free Stock Images

Premium

AI


Premium


Premium


Premium


Premium


Premium


Premium


Premium

Premium

Premium


Premium

Premium


Premium


Premium

Premium


Premium

Premium


Premium

Premium


Premium


Premium


Premium


Premium


Premium


Premium


Explore More Free Stock Images