1. Home > 
  2. Stock Photos > 
  3. Digital Data Analysis with Descending Graph Over Tech-Grid

Digital Data Analysis with Descending Graph Over Tech-Grid Image

Digital Data Analysis with Descending Graph Over Tech-Grid

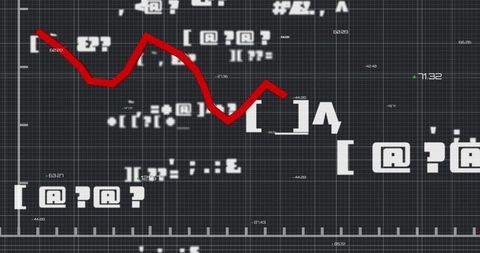
This image is suitable for representing statistical analyses and business data presentations, illustrating trends and technological innovation. It is ideal for use in business reports, presentations on data analysis strategies, or articles related to financial forecasting and digital technology developments.

Powered by Adobe logo
Financial data graph with rising and falling trends in vibrant colors - Powered by AdobeAI finance business data analysis digital technology investment trading market stock, financial analyst using advanced holographic interface for global market insight, smart investment strategy - Powered by Adobe
Dynamic blue and green digital stock market graph with bar charts and lines on a dark background, representing financial data analysis, investment trends, business growth, and global economy fluctuat - Powered by AdobeAn analyst uses a computer and dashboard for data business analysis and Data Management System with KPI and metrics connected to the database for technology finance, operations, sales, marketing  - Powered by AdobeBusinesswoman working on laptop with analytics graphs displayed on screen inside warehouse. Concept of logistics, supply chain, inventory management, shipping, ecommerce and distribution. - Powered by Adobe

Credit Photo

If you would like to credit the Photo, here are some ways you can do so

Free (free of charge)

Free for personal and commercial use.

Author: Awesome Content

Similar Free Stock Images

Green Data Graph on Black Digital Interface
Premium
Two professional analyzing financial data graphs, charts on laptop display at a modern workspace. Financial analysis or business evaluation concept
Digital Financial Chart with Green Trend Line on Grid Background
Red Line Graph Over Histogram Representing Financial Volatility
Dynamic Financial Data Graph with Global Grid Background
Green Line Chart on Digital Grid with Financial Data Points
Data Analysis and Cybersecurity Concept Art
Futuristic Financial Graph with Binary Code Overlay
Digital Data Processing Interface with Code and Graph
Futuristic Financial Data Display with Bitcoin Symbol
Multiethnic Team with Financial Graph Overlay and Laptops
Analog Clock with Falling Red Financial Chart on Futuristic Dark Grid Data Dashboard
Premium
Business finance data analytics graph.Financial management technology.Advisor using KPI Dashboard on virtual screen.
Digital Interface with Data Analytics Visualization
Digital Security and Data Analytics Overlaid in Blue Tones
Financial Market Data on Digital Interface with Declining Graph
Global Economic Trend Representation on Digital World Map
Declining Financial Market Chart Over Grid Background
Premium
Businessman working with modern computer virtual dashboard analyzing finance sales data and economic growth graph chart and block chain technology.
Real-Time Stock Market Data Interface with Declining Trend
Mathematical Formulas and Red Line Graph in Foggy Background
Modern Multi-Line Chart on Digital Display with Candlesticks
Futuristic Financial Data Visualization with Graph
Premium
Magnifying glass is on a black background with a red and blue line
Analyzing Growing Graph Line on Purple Gradient Background
Futuristic Stock Market Data Analysis Interface Artwork
Binary Code Financial Analytics with Rising Graph Line
Fluctuating Stock Market Graph with Symbols and Percentages
Digital Financial Growth with Crypto and NFT Symbols
Declining Stock Market Graph with Red Trend Line
Financial Data with Pound Symbol on Digital Interface Background
Business Data Technology Concept with Grid Overlay
Rising Green Line Chart Overlays Concept of Financial Growth
Falling Trend Line on Data Dashboard Background with Interactive Elements
Abstract Digital Chart with Cyber Grid Background
Stock Market Decline Data Analysis on Dark Grid Background
Dynamic Green Financial Graph with Business Icons
Premium
Big data technology Data science analysing artificial intelligence generative AI deep learning machine learning algorithm Neural flow network analytics innovation abstract futuristic. 3d rendering..
Premium
Marketing team analyzing data on laptop and pointing at screen during meeting
Premium
Business, finance and investment concept. Business man analyzing and calculating tax, interest rate, financial data with economic graph growth chart, strategy and budget planning.
Declining Financial Data with 5G Symbol and Graph Overlay
Declining Graph with 49% Reduction on Dark Digital Background
Global Financial Data and Graph Analysis Technology
Cybersecurity Warnings Overlaid on Financial Data and Stock Market Graph
Premium
Analyst working with Business Analytics and Data Management System on computer to make report with KPI and metrics connected to database. Corporate strategy for finance, operations, sales, marketing
Financial Growth Trends Over Cityscape Background
Digital Financial Report Analysis Overlaid on Office Scene
Digital Financial Interface with Dynamic Graphs and Data Analysis
Premium
Digital human body projection on futuristic screen displays medical data charts, graphs. Advanced technology for health analysis, patient monitoring. Futuristic interface for diagnostics, treatment
Futuristic Digital Dashboard with Business Data Analytics
Financial Data Analytics Overlaying Digital World Map Background
Global Business Analytics with Graph and Map Elements
Global Financial Decline Chart with Red Trend Line
Connected Media Icons over Data Visualization Interface
Financial Graph Over Cityscape Depicting Data Trends and Analytics
Descending Financial Graph on Global Grid Background
Financial Market Analysis Overlaying Urban Cityscape
Premium
businessman working with data and graphs in spreadsheet documents for online analysis Microsoft Excel project dashboard accounting digital
Premium
Business professional presenting data analysis
Premium
A close up of a screen displaying digital information and data with blue and orange highlights
Digital Lock with Real-Time Data Display
Financial Growth Chart with Dynamic Green Line on Grid Overlay
Digital Financial Analysis with Infographic and Data Flow
Financial Data Through Digital Networks with Stock Market Growth Trend
Premium
Ai generated image of blue financial graph with upward trend isolated on transparent background
Premium
Close-up of a soccer ball on green grass with sports data displayed, illuminating the night scene. Concept for sports betting strategy, financial analysis and market trends
Premium
Analyst working in Business Analytics and Data Management System to make report with KPI and metrics connected to database. Corporate strategy for finance, operations, sales, marketing.
Digital Currency Symbols on Dark Grid Background
Abstract Graph with Social Media Notification Icons and Data Points
6G Technology with Financial Data on Digital Screen
Social Media Engagement on Analytical Dashboard Display
Premium
Data science and big data technology. Data scientist computing, analysing and visualizing complex data set on computer. Data mining, artificial intelligence, machine learning, business analytics.
Dynamic Financial Chart with Red Line Graph on Digital Interface
Futuristic Data Analytics with Wireframe Head and Digital Features
Digital Security Illustration with Graph and Binary Codes
Digital Decline Graphic with QR Code Elements and Red Line
Premium
Representation of data analytics,charts, graphs and data driven insights emerging from a sea of information
Digital Data Analysis with Security Threat Warning
Futuristic Interface Displaying Dynamic Data Waves
Digital DNA and Data Analytics Fusion Visualization
Digital Financial Data with Graphs and Numbers on Blue Backdrop
Premium
Sales data analysis dashboard showing performance, trends, and insights. Sales data tracks growth, supports decisions, sales data boosts strategy, and sales data drives performance.
Premium
An analyst uses a computer and dashboard for data business analysis and Data Management System, Customers database, gather information to report. Data science technology and digital marketing
Premium
Business audit stock financial finance management on analysis data strategy with graph accounting marketing or report chart economy investment research profit concept
Financial Data Integration with Agricultural and Environmental Landscapes
Fluctuating Financial Graph With Data Visualization
Digital Data Processing Interface with Grid and Metrics
Financial Graph and Cityscape Analysis with Technological Overlay
Futuristic Data Dashboard Showing Dynamic Red Line Graph
Rising Green Financial Chart on Viral Pandemic Background
Dynamic Stock Market Data Display in Red and Green Ticker
Digital Financial Chart with Tickers and Percentage Analytics
Premium
Business growth and investment concept with upward arrow, financial data charts, profit and market strategy visualization on dark blue circuit technology background
Futuristic Digital Data Connections in a Server Room
Green Line Chart Overlay on Dark Financial Data Background
Futuristic Abstract Data Processing Interface
Digital Analytics Interface with Vibrant Data Display
Financial Data Analysis with Digital Graph Overlay
Financial Data Chart Over City Silhouette
Rising Sea Levels Impacting Economy Global Warming Concept
Digital Interface Displaying Volatile Financial Market Analysis
Dark Background with Digital Scanners and Stock Market Analysis
Global Financial Data and Social Media Escalation Chart
Digital Data Analysis Visualization with Graphs
Premium
Stock market investment trading graph growth.Trade business analytics graph and financial chart.Finance chart,stock market business and exchange financial growth graph.
Digital Dashboard Analytics Graphic Illustrating Trends
Financial Chart with Dynamic Numbers on Grid Background
Futuristic Data Processing Interface with Dynamic Graphs
Digital Interface Displaying Receiving Files Progress
Premium
Colorful digital data visualization with glowing vertical bars and lines in warm and cool tones representing abstract technology and data analysis
Green Line Chart with Financial Data on Digital Display
Digital Interface with Data Processing Visualization
Bright Green Sales Statistics on Futuristic Grid Display
Dynamic Stock Market Data with Fluctuating Graph
Global Data Exchange Network
Sharp Decline in Stock Market Graph Against Red Financial Data Background
Digital Hologram with Dynamic Numbers on Graph Grid
Stock Market Downturn Depicted with Red Line on Blue Digital Display
Premium
A businessman uses advanced technology to analyze financial growth trends, illustrated by modern graphs and data visualizations in a corporate setting. Impute
Digital Data Analysis on Blue Grid Background with Graphs
Eye Chart with Digital Data Integration Visualizing Business Trends
Falling Stock Market Data with Red Line Indicator
COVID-19 Data Analysis with Digital Graph Visualization
Premium
Big data technology Data science analysing artificial intelligence generative AI deep learning machine learning algorithm Neural flow network analytics innovation abstract futuristic. 3d rendering..
Digital Financial Data Analysis with Futuristic Charts
Explore More Free Stock Images