1. Home > 
  2. Stock Photos > 
  3. Digital Data Analysis with Dynamic Graphs and Numbers

Digital Data Analysis with Dynamic Graphs and Numbers Image

Digital Data Analysis with Dynamic Graphs and Numbers

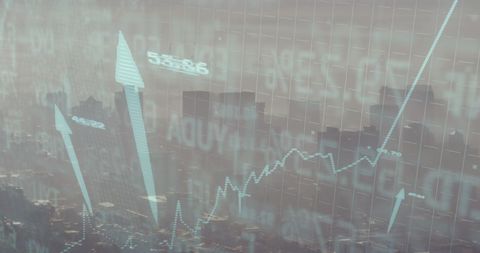
Abstract depiction of digital data processing showcasing vivid graphs and numerical figures against a dark background. This image encapsulates themes of global business, finance, stock market activities, and digital technology. Ideal for use in presentations, marketing materials, tech-related publications, or financial reports aiming to convey data-driven topics and analysis.

Powered by Adobe logo
A business professional engaged in analyzing digital reports on a laptop, featuring various data visualizations including graphs and charts in a modern office setting. Impute - Powered by AdobeBig data and AI technology, Business intelligence and AI data science, Automating data processing, Machine learning and business intelligence, AI driven data processing, KPI performance monitoring. - Powered by AdobeFuturistic digital business growth chart with glowing blue arrow and icons for time management process optimization and financial data analysis on a dark technology background - Powered by AdobeBusinesswoman working on laptop with analytics graphs displayed on screen inside warehouse. Concept of logistics, supply chain, inventory management, shipping, ecommerce and distribution. - Powered by AdobeBusinessman hand signs important document with pen. Digital tech lines, glowing dots connect around form. Shows modern contract, future agreement, business innovation, secure data management, smart - Powered by Adobe

Credit Photo

If you would like to credit the Photo, here are some ways you can do so

Free (free of charge)

Free for personal and commercial use.

Author: Creative Art

Similar Free Stock Images

Financial Data Analysis on Digital Grid Background
Premium
Wooden blocks with business icons representing financial growth, data analysis, strategic ideas, and operational processes on a light wooden surface.
Digital Financial Data Over Escalator Representing Economic Trends
Dynamic Global Financial Data Overlaying Cityscape
Stock Market Data Overlaid on Urban Construction Scene
Stock Market Graph Reflecting Financial Trends and Analysis
Futuristic Financial Data Display Over Cityscape
Digital Data Analysis Over Cityscape with Scope Overlay
Abstract Financial Data Visualized Over World Map
Abstract Digital Data Processing Background with Graphs
Financial Data Analytics with Cityscape Backdrop
Analyzing Global Data with Abstract Digital Interfaces and Connections
Premium
Colorful bar chart showing data analysis and growth
Abstract Financial Chart Overlay City
Digital Fluorescent Data Visuals Overlapping Cityscape Silhouette
Financial Data Streams and City Traffic Concept
Premium
refund, pending, payment, processing, finance, Person reviewing payment transaction and refund status using calculator and laptop, representing finance management, processing, and digital billing.
Premium
A business professional engages with high-tech financial data on a laptop screen, showcasing vibrant graphs and charts illustrating market trends and analysis. Copula
Dynamic Financial Graphs Overlaying Cityscape Symbolizing Global Economy
Digital Financial Data Visualization with Office Background
Financial Data Analytics and Global Cityscape with Futuristic Display
Global Financial Data and Digital Interface Concepts
Premium
Collection of business and workflow icons representing collaboration, processes, and data analysis
Dynamic Financial Data Over Futuristic Building Render
City Skyline Merging with Financial Graphs Demonstrating Market Trends
Digital Data Security and Global Internet Connections Concept
Financial Data Overlay on Modern Bank Architecture Illustrating Market Trends
Premium
Payroll Management and Salary Processing System. Businesswoman calculates payroll, with icons representing employee salaries management, payment scheduling, efficient payroll, financial documentation,
Premium
Data evolution infographic showing transformation from raw to cleaned for actionable insight and value in clean graphic style, business data metaphor.
Global Finance Graphics Showing Market Data on World Map
Financial Graph Data Overlaying Urban Cityscape
Futuristic financial data visualizing neon candlesticks and dotted peaks over world map
Global Financial Data Overlay on Urban Skyline for Business Concept
Stock Market Trends Visualized Against Urban Construction
Digital Data Analysis Overlapping Modern Urban Skyline
Smart City and Financial Growth with Digital Graphs
Digital Graph Showing Data Processing on Dark Tech Background
Premium
Human hand in a suit jacket touching a futuristic glowing robot finger, symbolizing the integration of artificial intelligence and advanced technology in business and future innovation
Premium
Artificial intelligence data optimization and automated business workflow with glowing icons and futuristic interface
Abstract Data Network Background Visualizing Digital Connectivity
Stock Market Graphs Overlay on City Skyline Backdrop
Cityscape with Stock Market Data Graphics Overlay
Digital Data Visualization with Dynamic Stock Market Charts
Financial Data Graphs Overlaying Urban Skyline
Premium
Business analyst working on laptop with holographic dashboard charts and data visualization graphs. Concept of big data, analytics, business intelligence, and financial statistics. crm marketing
Businesswoman Analyzing Financial Data with Mixed Reality Interface
Global Financial Data Analysis with Digital Graphics
Financial Graphs Overlay on Cityscape Featuring Global Economy Theme
Global Digital Data Processing on World Map with Graph and Network Overlay
Premium
New rules message on notecard with magnifying glass, pen, calculator and business charts in office setting
Digital Data Streams Overlay Global Cityscape
Global Financial Trends with Digital World Map and Data Charts
Digital Data Overlay on Modern Urban Skyline
Dynamic Financial Data Processing Over Skyscrapers
Premium
Analyzing business data trends using a tablet outdoor setting digital content golden hour informative perspective
Dynamic Financial Graphs Over City Background
Digital Financial Data Over World Map in Data Center
Growing Financial Graph Overlay on Cityscape Background
Abstract Financial Data Display with Analytical Graphs
Financial Data Overlay with Urban Background Illustration
Digital Graphs Overlaying Cityscape Reflecting Economic Trends
Digital Financial Data Over Urban High-Rise Skyline
Finance Data Learning: Economic Trends and Market Analysis
Statistics and Financial Data on Global Entrepreneurship
Premium
Professional hand interacts with a futuristic digital interface displaying glowing business data icons against a blurred blue city night background illustrating growth an
Premium
A point cloud representation of a large industrial interior, showcasing the complexity of the structure with a vibrant color palette and intricate detail
Premium
Credit card payment processing transaction on pos terminal
Financial Data Illustration on City Skyline Background
Financial Data Analysis Over Visualized Scaffolding Framework
Global Data Processing Over Cityscape Night View
Premium
Teamwork process, Business team using a calculator to calculate the numbers of statistic business profits growth rate on documents graph data, desk in the office.
Premium
Focused Analysis: A top-down perspective of a focused individual in a professional setting, engrossed in detailed financial reports and data analysis, the essence of business
Financial Data Security Concept with Graphs and Padlock
Financial Technology Overlaying Bustling Cityscape at Night
Digital Financial Graph Over Cityscape at Dusk
Digital Financial Graph Overlay with Cityview Background
Premium
e wallet integration concept. Digital representation of a successful financial transaction with credit card and coins.
Global Stock Market Graph on a Digital World Map
Dynamic Financial Data Analysis Charts with Green Digital Grid
Global Data Exchange and Stock Market Analysis Over World Map
Abstract Financial Graphs Overlapping Urban Skyline
Premium
Businessman signing digital contract, business innovation concept. Technology connection, verification, compliance, finance, network, futuristic strategy, secure data processing.
Financial Data and Charts Overlay Cityscape Illustrating Global Economy
Global Financial Data Display on World Map Background
Cityscape Overlaid with Financial and Stock Market Data
City Skyline with Abstract Financial Graph Overlay
Premium
Business people organizing tax checklist through virtual interface. Tax planning services to maximize tax savings and optimize business finances
Financial Data Projection on Scaffolding Structure
Financial Data and Graphs Overlaying a Cityscape
Digital Financial Data Display Over Cityscape
Dynamic Financial Data Graphs Overlay Cityscape
Premium
Person balancing digital business icons on a scale, representing data analysis, strategic decision-making, and performance evaluation.
Digital Global Stock Market Analysis Over World Map
Cityscape with Overlay of Stock Market Graph Highlighting Financial Growth
Dynamic Financial Data Graph Overlaying Urban Skyline
Data Processing with Stock Market Charts and Numbers Background
Global Data Processing with Digital Interface and World Map
Financial Data Overlay with Cityscape Background
Digital Stock Market Graphs Over Urban Skyline
Financial Data and Graphs Overlaying Cityscape
Global Financial Data Overlay on Digital World Map
Digital Data Overlay on Cityscape Reflecting Global Business Trends
Financial Graphs and Cityscape Merging Conceptualizing Economy
Financial Data Processing with Global Business Analytics
Premium
Data center with a blurred image of the data. Video of financial information server with realistic visualization. International commerce and financial management room with lifestyle interfaces.
Dynamic Visualization of Financial Markets on Dark Background
Financial Data and Graphs Overlaying Urban Cityscape
Digital Financial Data Processing on Notepad Screen
Digital Financial Data Overlay on Urban Skyscrapers
Global Financial Data Processing Digital Interface
Abstract Stock Market Data Visualization
Abstract Image of Digital Financial Data on Transparent Screen
Digital Financial Data Visualization Over Dusk Cityscape
Futuristic Data Analysis with Interactive Graphs
Premium
A magnifying glass sits on a stack of documents next to glowing 3D pie and bar charts, representing data analysis, business research, financial statistics, and audit processes.
Futuristic Financial Data Analysis with Dynamic Charts and Graphs
Advanced Financial Data Processing Chart Visualization
Abstract Financial Data Concepts over Cityscape
Financial Data Visualization with Urban Cityscape Background
Premium
Business analyst interacting with big data dashboard for process efficiency and production analysis
Abstract Digital Interface with Glowing Data Metrics
Colorful Graph Displaying Stock Market Trends on Digital Grid
Global Economic Trends Overlapping Environmental Issues
Stock Market Journey Depicted Through Rising and Falling Index
Premium
Businessman using AI predictive analytics with futuristic data visualization, graphs, and charts for business intelligence and technology solutions.
Explore More Free Stock Images