
- Home >
- Stock Photos >
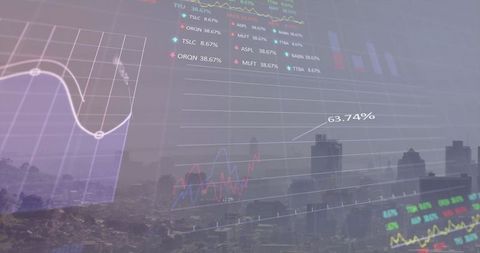
- Digital Data Analysis with Financial Graphs Interface
Digital Data Analysis with Financial Graphs Interface Image

Visual representing complex data analysis in a business or financial setting. Ideal for illustrating topics related to stock market evaluation, financial strategies, technology conferences, or data processing methodologies. Suitable for use in blog posts, presentations, or publications about fintech and new age data techniques.
Powered by  - Get 15% off with code: PIKWIZARD15


downloads
Tags:
More
Credit Photo
If you would like to credit the Photo, here are some ways you can do so
Text Link
photo Link
<span class="text-link">
<span>
<a target="_blank" href=https://pikwizard.com/photo/digital-data-analysis-with-financial-graphs-interface/7b86e38ce5fdc80bce380827008b2f62/>PikWizard</a>
</span>
</span>
<span class="image-link">
<span
style="margin: 0 0 20px 0; display: inline-block; vertical-align: middle; width: 100%;"
>
<a
target="_blank"
href="https://pikwizard.com/photo/digital-data-analysis-with-financial-graphs-interface/7b86e38ce5fdc80bce380827008b2f62/"
style="text-decoration: none; font-size: 10px; margin: 0;"
>
<img src="https://pikwizard.com/pw/medium/7b86e38ce5fdc80bce380827008b2f62.jpg" style="margin: 0; width: 100%;" alt="" />
<p style="font-size: 12px; margin: 0;">PikWizard</p>
</a>
</span>
</span>
Free (free of charge)
Free for personal and commercial use.
Author: Creative Art
Similar Free Stock Images

Premium


Premium


Premium


Premium


Premium


Premium


Premium


Premium


Premium

Premium


Premium


Premium


Premium


Premium


Premium


Premium


Premium


Premium

Premium


Premium


Premium

Premium

Premium


Premium


Premium

Explore More Free Stock Images