- Home >
- Stock Photos >
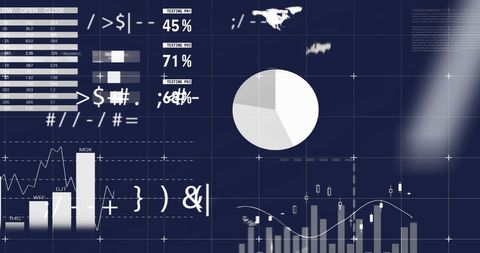
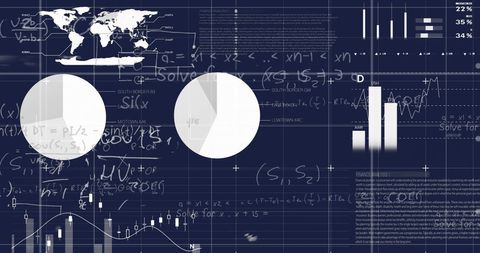
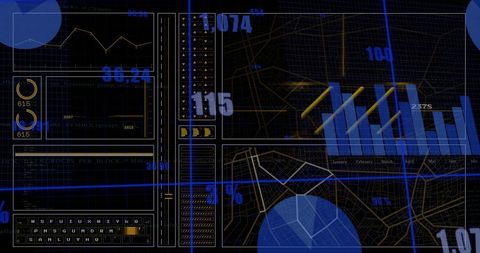
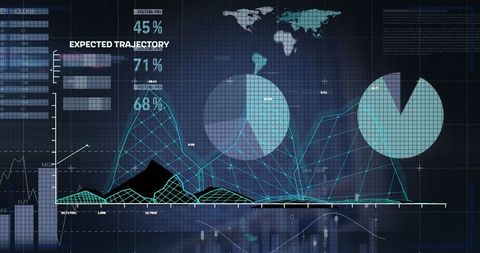
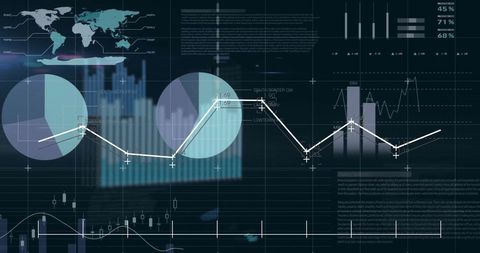
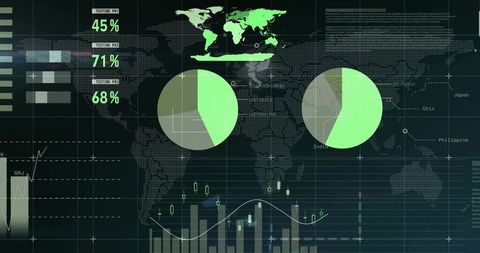
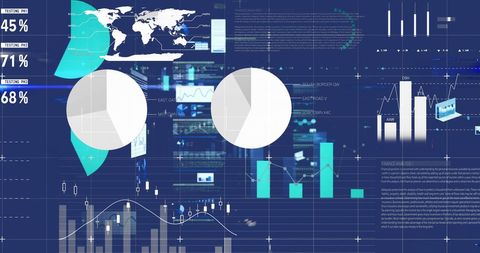
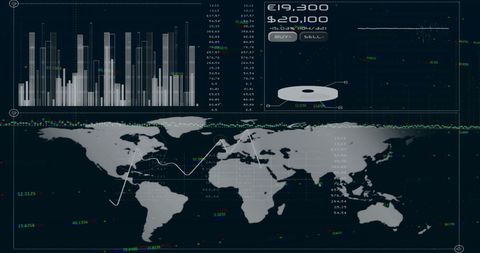
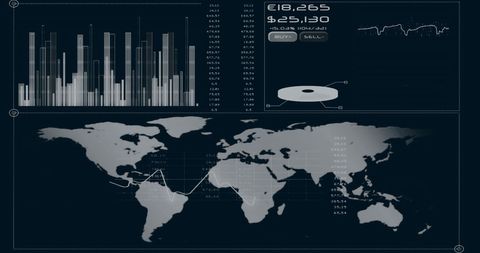
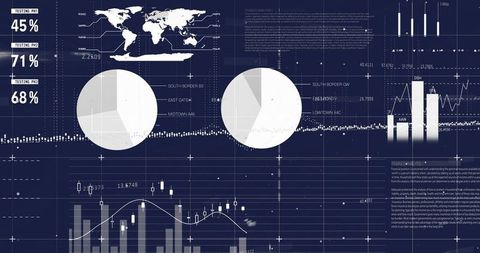
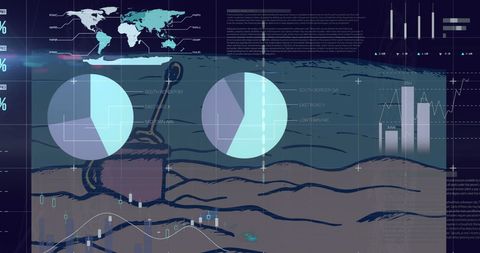
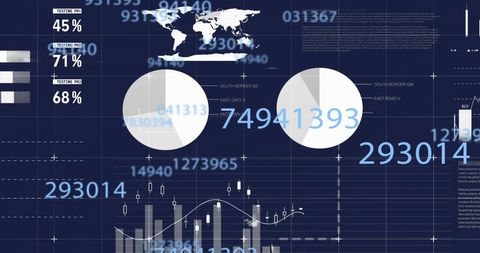
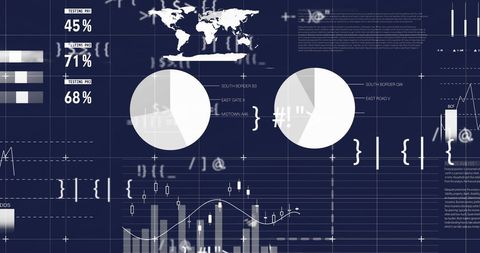
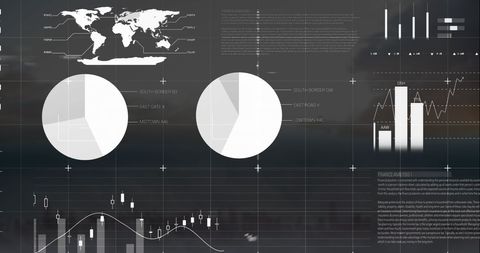
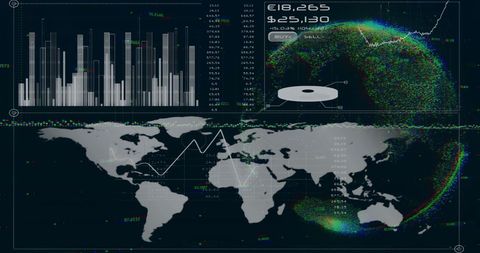
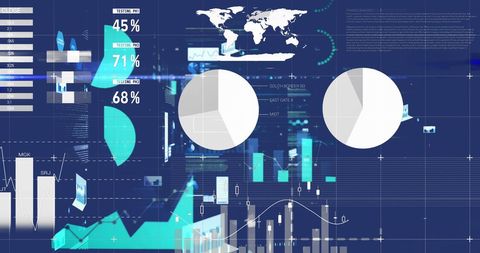
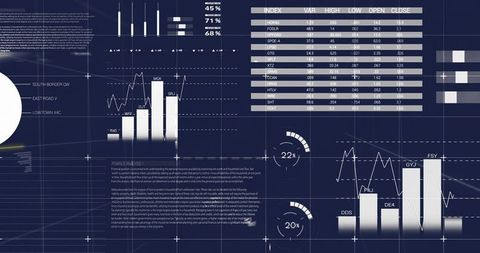
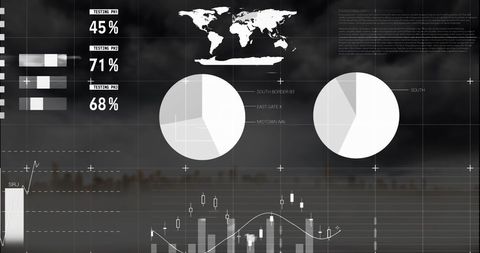
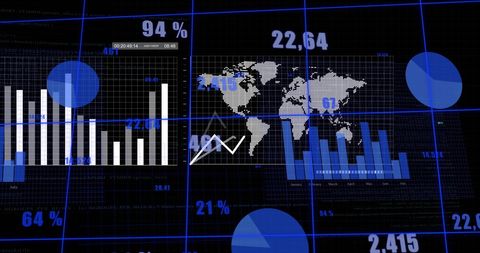
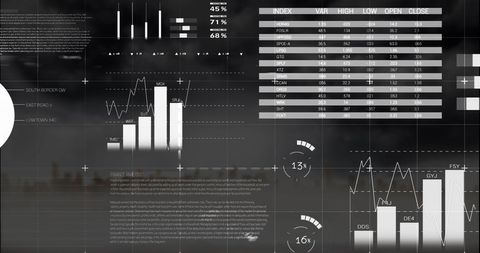
- Digital Data Analysis with Global Indicators
Digital Data Analysis with Global Indicators Image
Illustration shows digital data analysis with graphs, charts, and global map on dark background. Percentages and data trends evoke themes of technology and finance. Suitable for technology blogs, business strategy presentations, financial forecasts, or educational materials on data science.

downloads
Tags:
More
Credit Photo
If you would like to credit the Photo, here are some ways you can do so
Text Link
photo Link
<span class="text-link">
<span>
<a target="_blank" href=https://pikwizard.com/photo/digital-data-analysis-with-global-indicators/7124c26df2d60ef049dd0bd89685963d/>PikWizard</a>
</span>
</span>
<span class="image-link">
<span
style="margin: 0 0 20px 0; display: inline-block; vertical-align: middle; width: 100%;"
>
<a
target="_blank"
href="https://pikwizard.com/photo/digital-data-analysis-with-global-indicators/7124c26df2d60ef049dd0bd89685963d/"
style="text-decoration: none; font-size: 10px; margin: 0;"
>
<img src="https://pikwizard.com/pw/medium/7124c26df2d60ef049dd0bd89685963d.jpg" style="margin: 0; width: 100%;" alt="" />
<p style="font-size: 12px; margin: 0;">PikWizard</p>
</a>
</span>
</span>
Free (free of charge)
Free for personal and commercial use.
Author: People Creations