
- Home >
- Stock Photos >
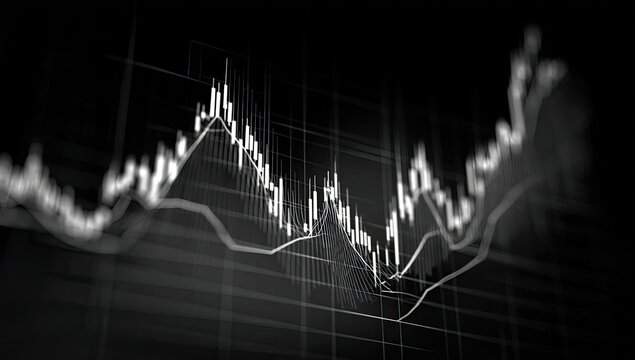
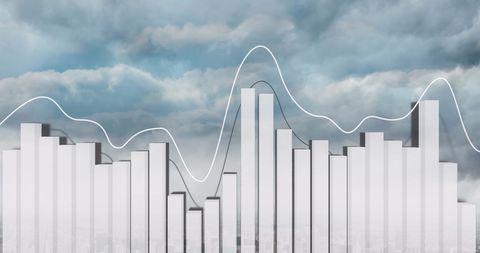
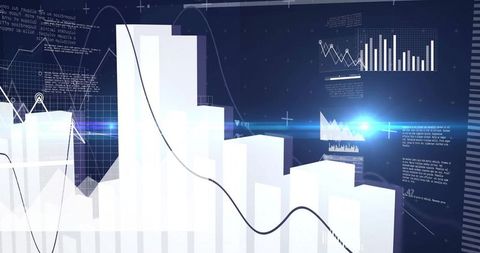
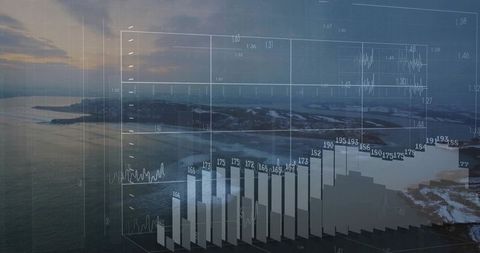
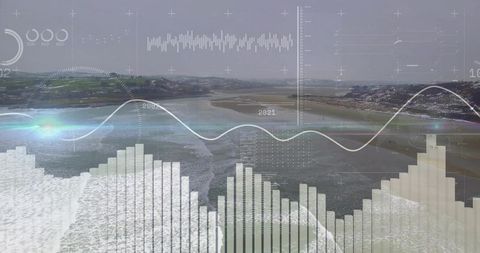
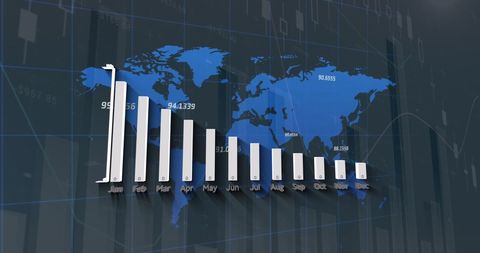
- Digital Data Analysis with Graph and Bar Chart
Digital Data Analysis with Graph and Bar Chart Image

This visual representation of data with graphs and bar charts evokes concepts in analytics and finance, often used in presentations or reports concerning business trends. This design is suitable for articles, blogs, or lectures discussing global business strategy, market analysis, or data processing technology.
Powered by 


downloads
Tags:
More
Credit Photo
If you would like to credit the Photo, here are some ways you can do so
Text Link
photo Link
<span class="text-link">
<span>
<a target="_blank" href=https://pikwizard.com/photo/digital-data-analysis-with-graph-and-bar-chart/eb3a2754e4466b2923f97e12ea547aaa/>PikWizard</a>
</span>
</span>
<span class="image-link">
<span
style="margin: 0 0 20px 0; display: inline-block; vertical-align: middle; width: 100%;"
>
<a
target="_blank"
href="https://pikwizard.com/photo/digital-data-analysis-with-graph-and-bar-chart/eb3a2754e4466b2923f97e12ea547aaa/"
style="text-decoration: none; font-size: 10px; margin: 0;"
>
<img src="https://pikwizard.com/pw/medium/eb3a2754e4466b2923f97e12ea547aaa.jpg" style="margin: 0; width: 100%;" alt="" />
<p style="font-size: 12px; margin: 0;">PikWizard</p>
</a>
</span>
</span>
Free (free of charge)
Free for personal and commercial use.
Author: Authentic Images
Similar Free Stock Images

Premium

Premium


Premium


Premium

Premium


Premium


Premium


Premium


Premium

Premium


Premium


Premium

Premium


AI

Premium


Premium

Premium


Premium


Premium


Premium


Premium


Premium


Premium

Premium


Premium


Premium


Explore More Free Stock Images