- Home >
- Stock Photos >
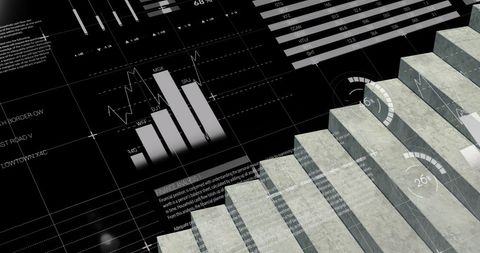
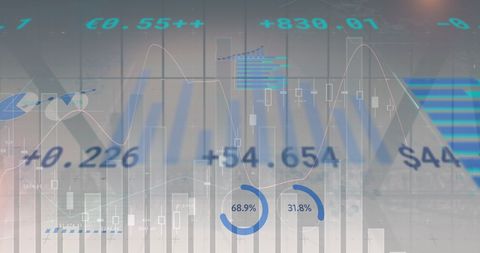
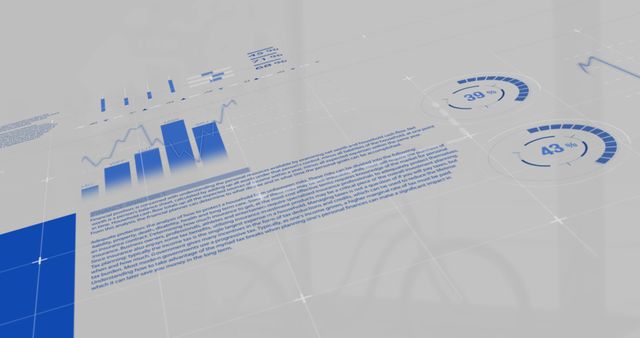
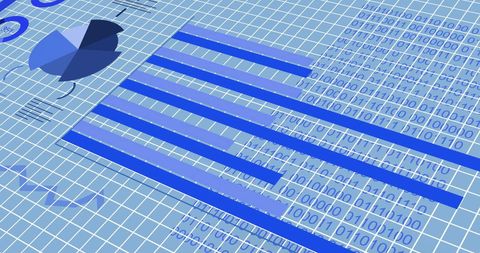
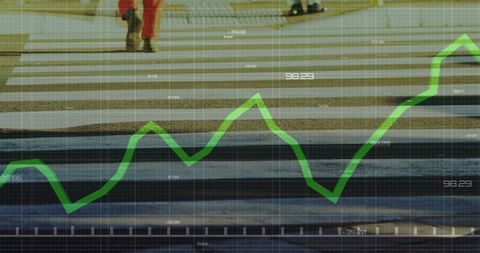
- Digital Data Analysis with Graphs and Binary Code Overlay
Digital Data Analysis with Graphs and Binary Code Overlay Image

Futuristic digital interface showing graphs combined with binary code representing advanced data analysis. Ideal for illustrating modern technology's role in finance and business strategy presentations, articles on data processing, and showcasing innovative tech solutions.

downloads
Tags:
More
Credit Photo
If you would like to credit the Photo, here are some ways you can do so
Text Link
photo Link
<span class="text-link">
<span>
<a target="_blank" href=https://pikwizard.com/photo/digital-data-analysis-with-graphs-and-binary-code-overlay/f045c8fc21a2219acfd8c3ec9945a74c/>PikWizard</a>
</span>
</span>
<span class="image-link">
<span
style="margin: 0 0 20px 0; display: inline-block; vertical-align: middle; width: 100%;"
>
<a
target="_blank"
href="https://pikwizard.com/photo/digital-data-analysis-with-graphs-and-binary-code-overlay/f045c8fc21a2219acfd8c3ec9945a74c/"
style="text-decoration: none; font-size: 10px; margin: 0;"
>
<img src="https://pikwizard.com/pw/medium/f045c8fc21a2219acfd8c3ec9945a74c.jpg" style="margin: 0; width: 100%;" alt="" />
<p style="font-size: 12px; margin: 0;">PikWizard</p>
</a>
</span>
</span>
Free (free of charge)
Free for personal and commercial use.
Author: Creative Art