
- Home >
- Stock Photos >
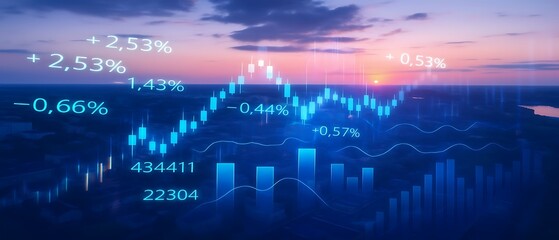
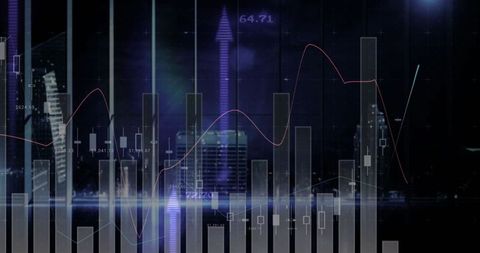
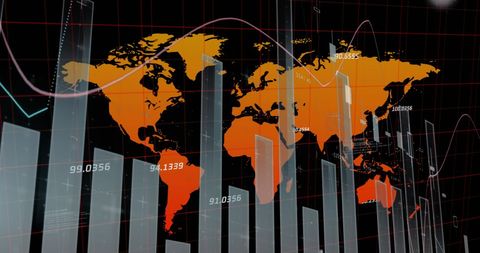
- Digital Data Analysis with Graphs and Numbers Overlay
Digital Data Analysis with Graphs and Numbers Overlay Image

This abstract depiction of financial data includes bar graphs and numbers. Suitable for business presentations, financial reports, illustrating stock market trends, or content about economic analysis and market forecasting. The digital interface suggests modern, data-driven connections important in global finance.
Powered by 


downloads
Tags:
More
Credit Photo
If you would like to credit the Photo, here are some ways you can do so
Text Link
photo Link
<span class="text-link">
<span>
<a target="_blank" href=https://pikwizard.com/photo/digital-data-analysis-with-graphs-and-numbers-overlay/7efbcd5476d22c775aa3064fd9502d22/>PikWizard</a>
</span>
</span>
<span class="image-link">
<span
style="margin: 0 0 20px 0; display: inline-block; vertical-align: middle; width: 100%;"
>
<a
target="_blank"
href="https://pikwizard.com/photo/digital-data-analysis-with-graphs-and-numbers-overlay/7efbcd5476d22c775aa3064fd9502d22/"
style="text-decoration: none; font-size: 10px; margin: 0;"
>
<img src="https://pikwizard.com/pw/medium/7efbcd5476d22c775aa3064fd9502d22.jpg" style="margin: 0; width: 100%;" alt="" />
<p style="font-size: 12px; margin: 0;">PikWizard</p>
</a>
</span>
</span>
Free (free of charge)
Free for personal and commercial use.
Author: Authentic Images
Similar Free Stock Images

Premium


Premium


Premium


Premium


Premium


Premium

Premium


Premium


Premium


Premium


Premium


Premium


Premium

Premium


Premium


Premium

Premium


Premium


Premium


Premium


Premium


Premium


Premium


Premium


Premium
Explore More Free Stock Images