
- Home >
- Stock Photos >
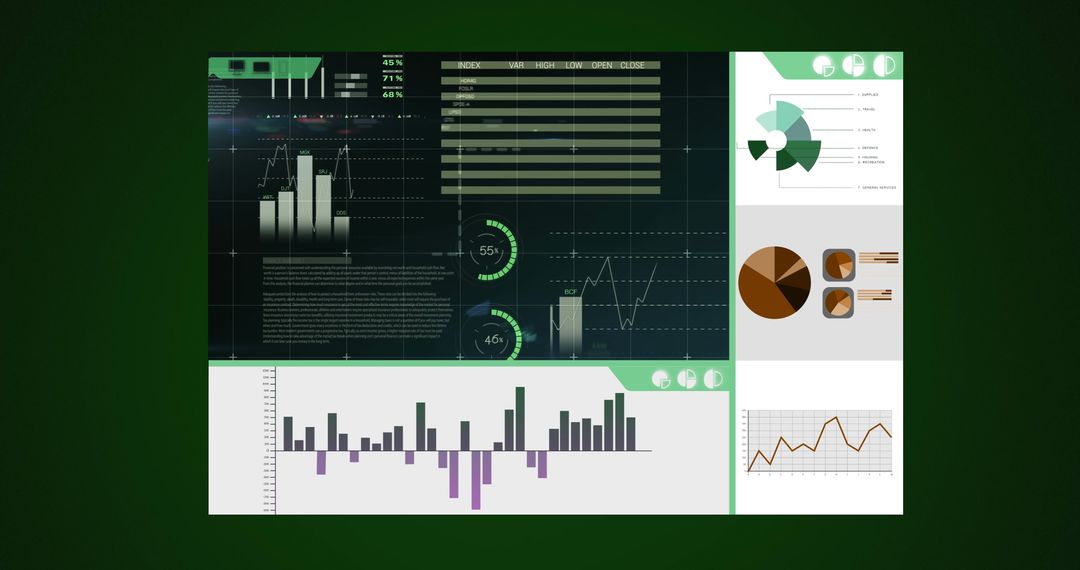
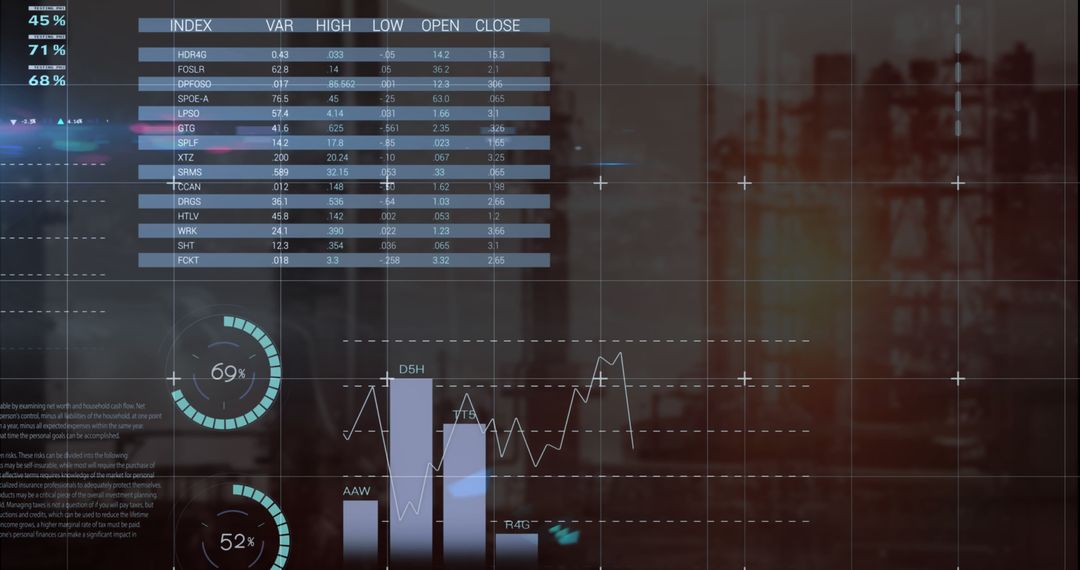
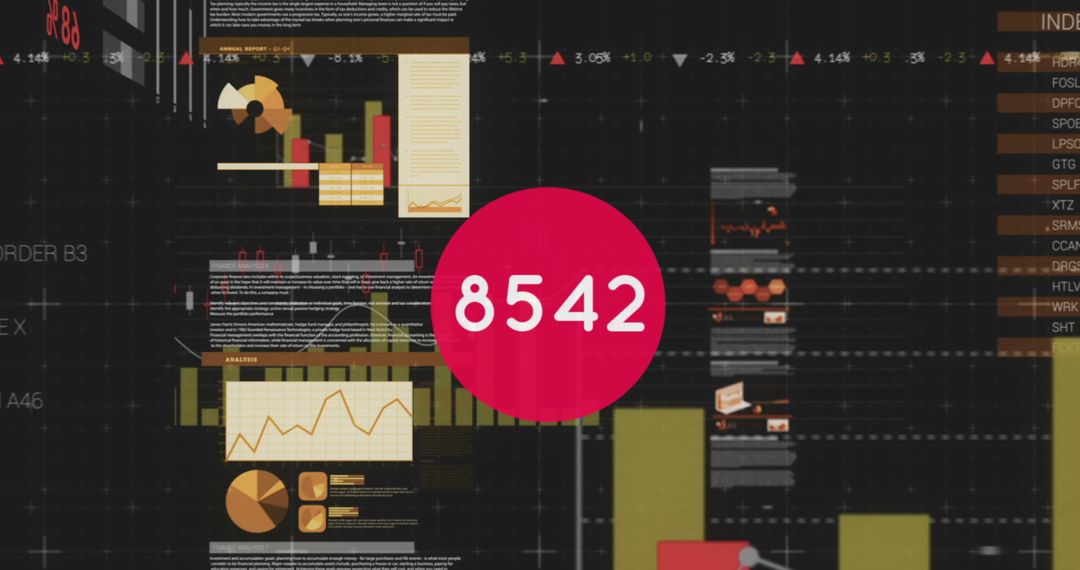
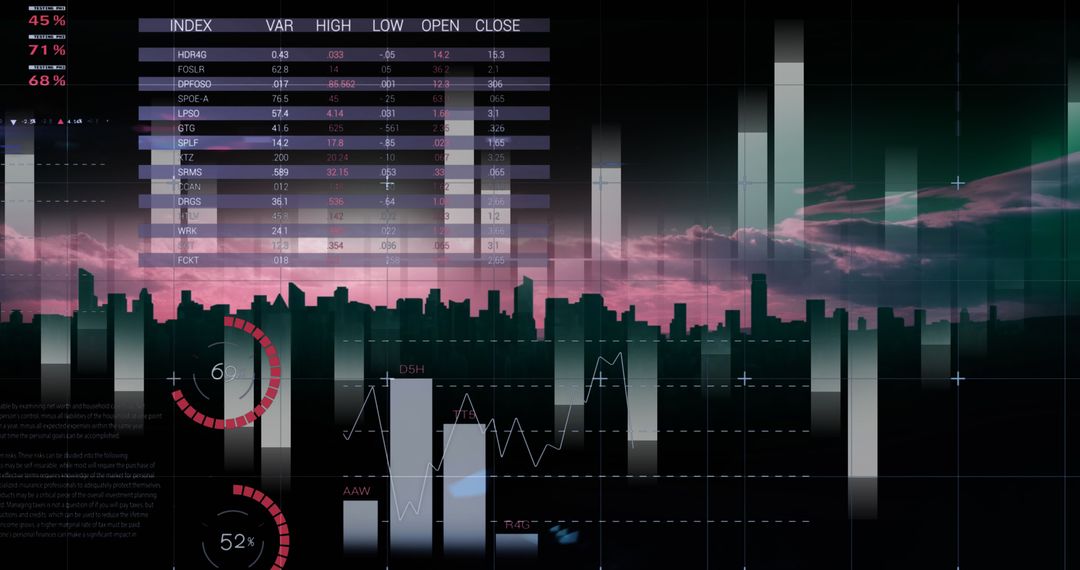
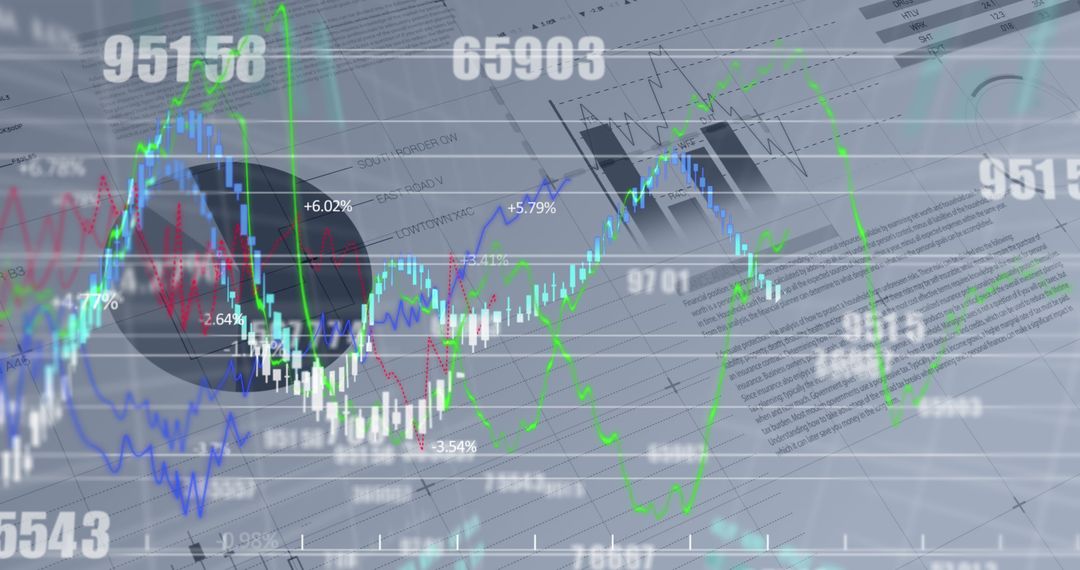
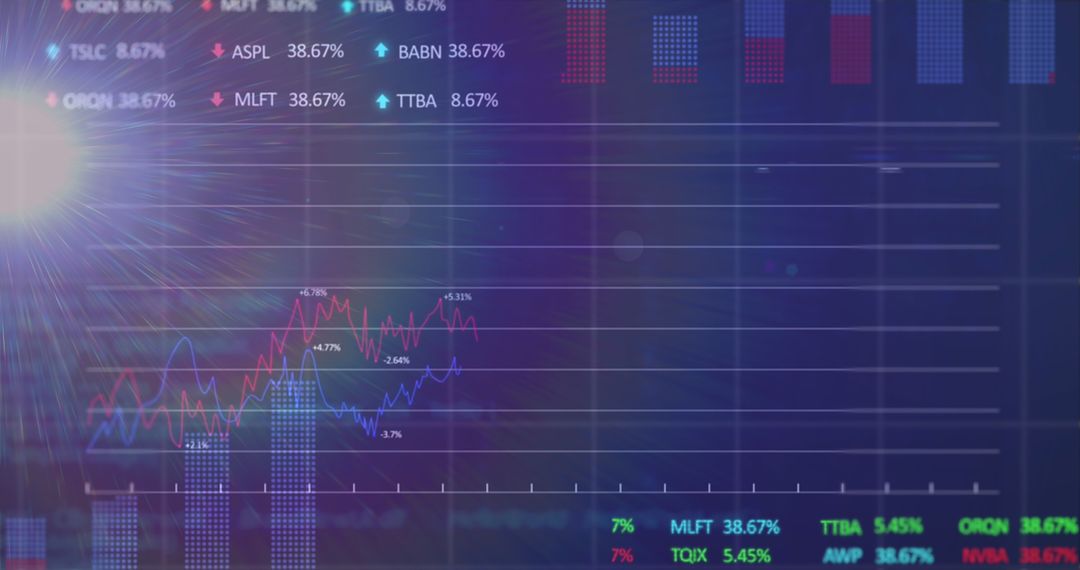
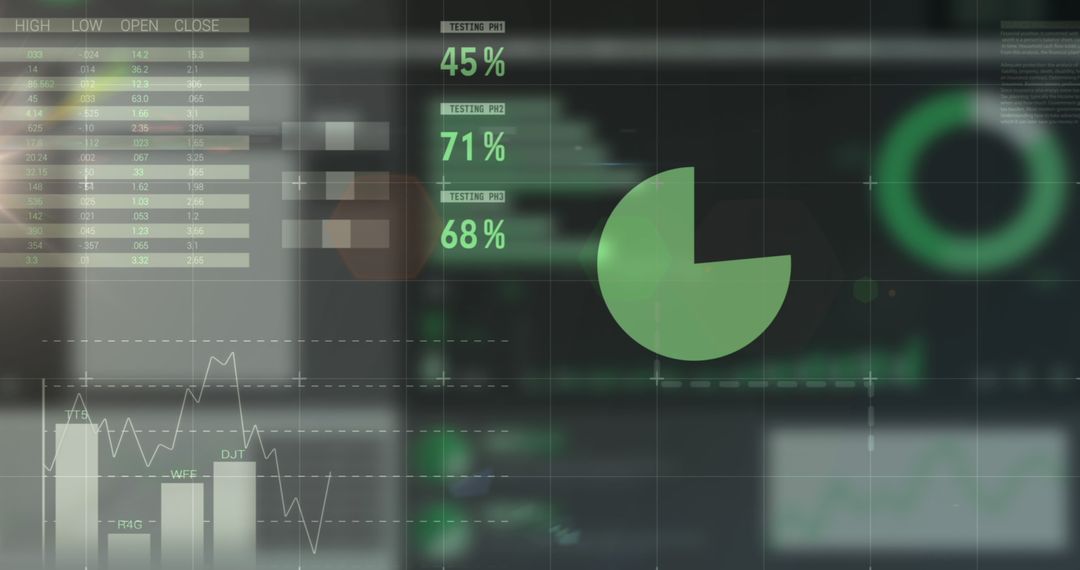
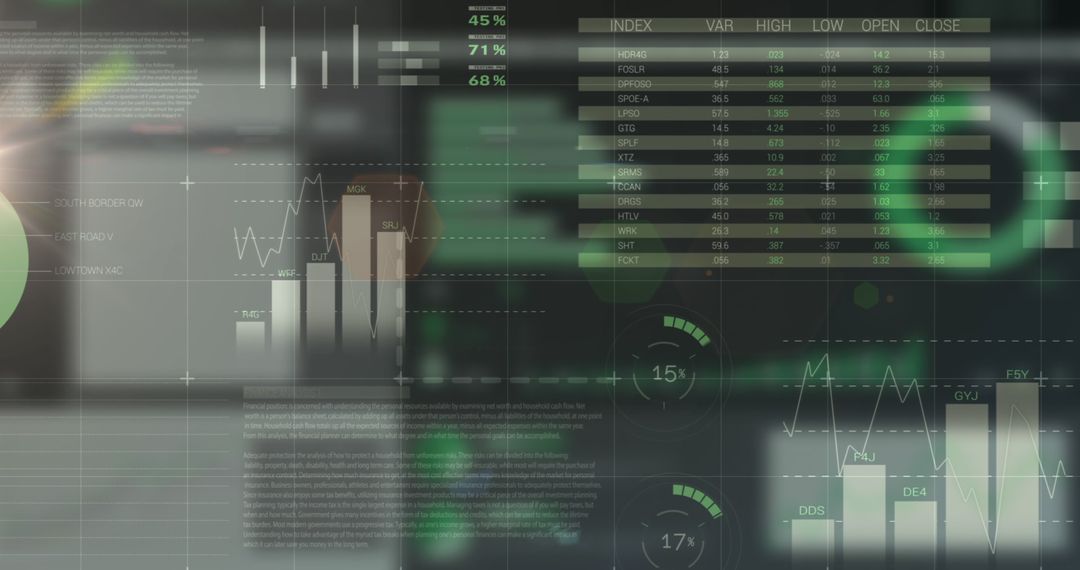
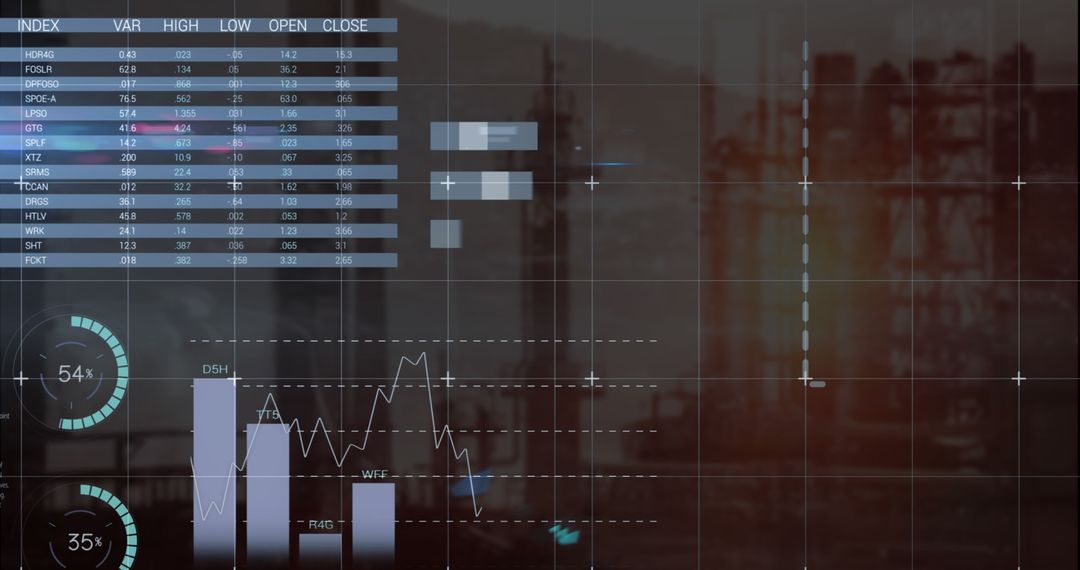
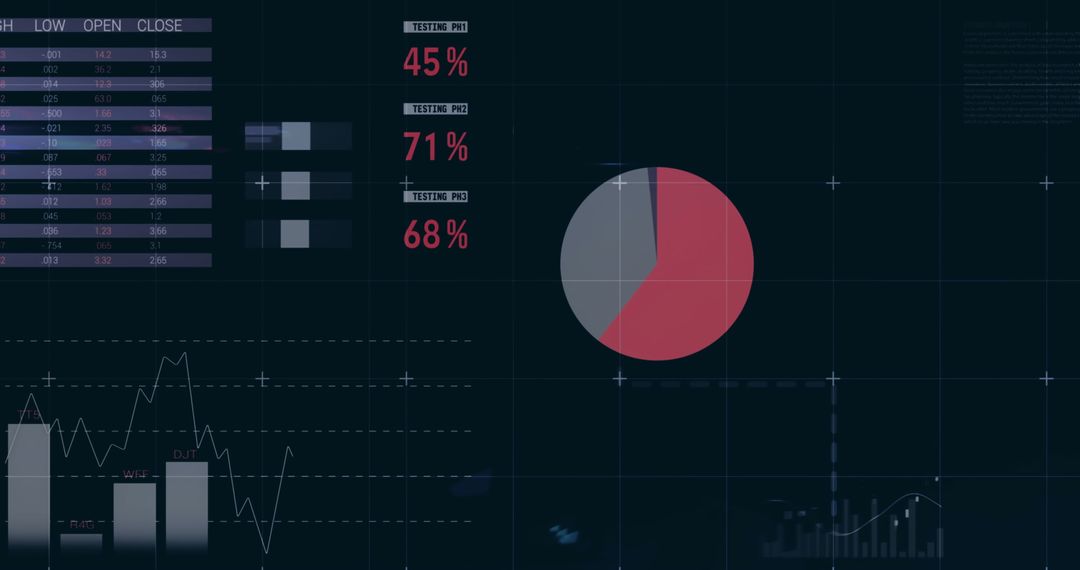
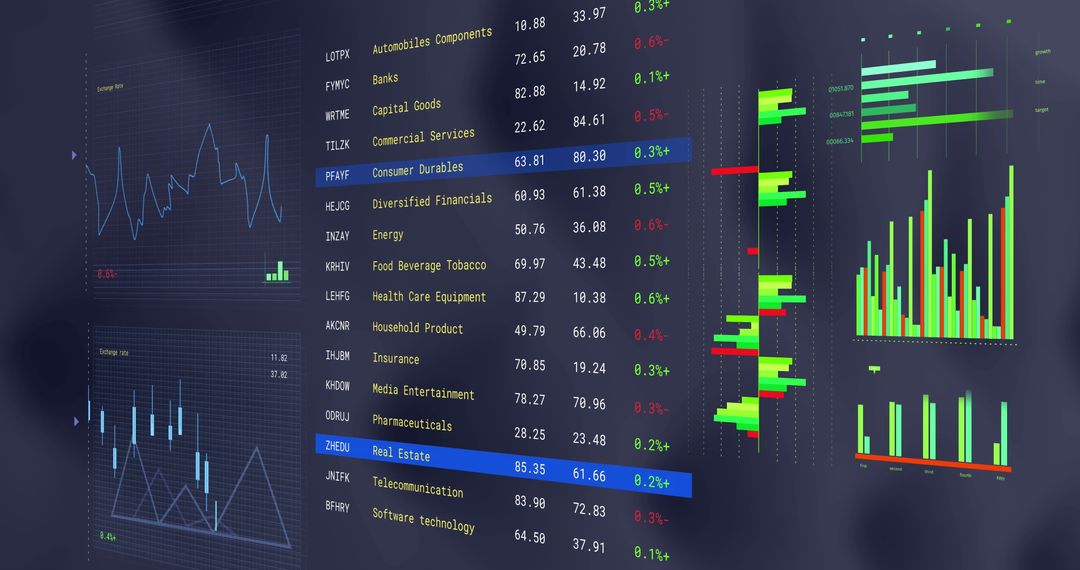
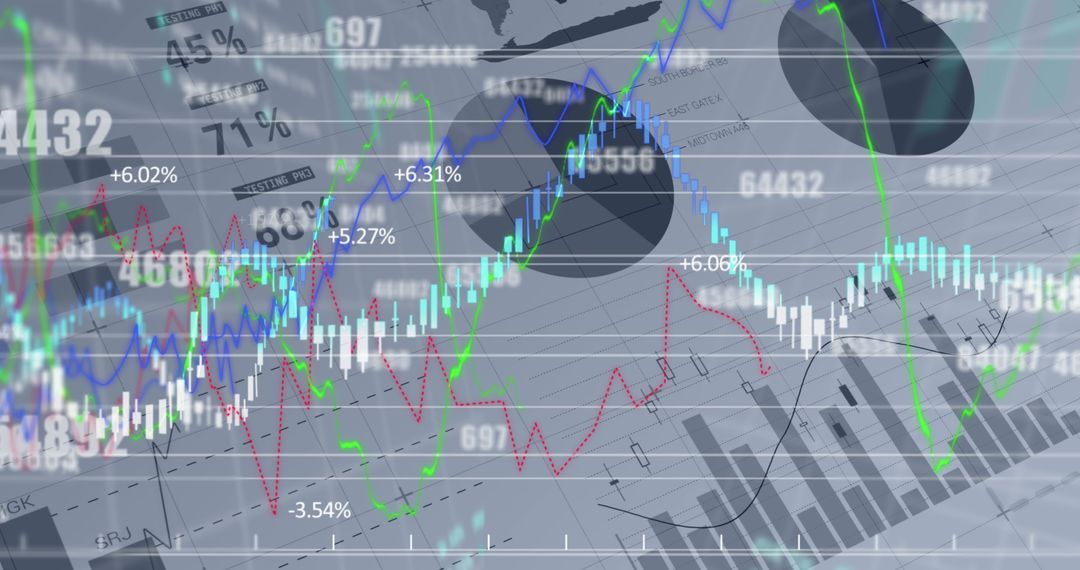
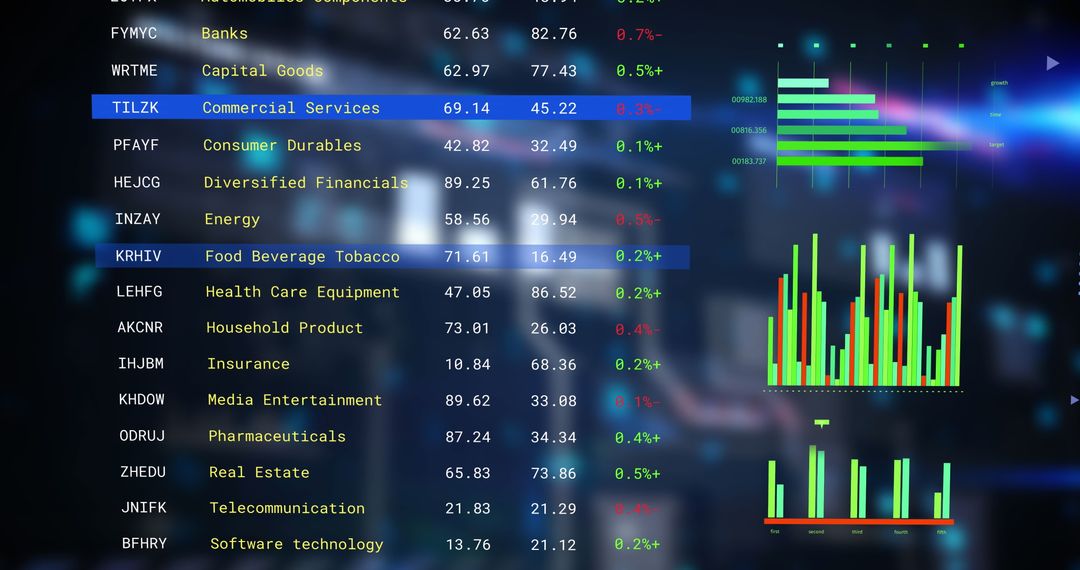
- Digital Data Analysis with Graphs and Percentages on Screen
Digital Data Analysis with Graphs and Percentages on Screen Image
Visualizes digital data analysis with graphs, percentages on digital screen. Ideal for technology, business analytics, global finance contexts. Useful for presentations, reports, tech blogs illustrating how data is processed, analyzed in a digital environment.
Powered by  - Get 15% off with code: PIKWIZARD15


0
downloads
downloads
Tags:
More
Credit Photo
If you would like to credit the Photo, here are some ways you can do so
Text Link
photo Link
<span class="text-link">
<span>
<a target="_blank" href=https://pikwizard.com/photo/digital-data-analysis-with-graphs-and-percentages-on-screen/7e587ba275dcc9abc2b6a4edeef30c6a/>PikWizard</a>
</span>
</span>
<span class="image-link">
<span
style="margin: 0 0 20px 0; display: inline-block; vertical-align: middle; width: 100%;"
>
<a
target="_blank"
href="https://pikwizard.com/photo/digital-data-analysis-with-graphs-and-percentages-on-screen/7e587ba275dcc9abc2b6a4edeef30c6a/"
style="text-decoration: none; font-size: 10px; margin: 0;"
>
<img src="https://pikwizard.com/pw/medium/7e587ba275dcc9abc2b6a4edeef30c6a.jpg" style="margin: 0; width: 100%;" alt="" />
<p style="font-size: 12px; margin: 0;">PikWizard</p>
</a>
</span>
</span>
Free (free of charge)
Free for personal and commercial use.
Author: People Creations
Similar Free Stock Images

Premium


Premium


Premium


Premium


Premium


Premium


Premium


Premium


Premium


Premium


Premium


Premium


Premium


Premium


Premium


Premium


Premium


Premium


Premium


Premium


Premium


Premium


Premium


Premium

