- Home >
- Stock Photos >
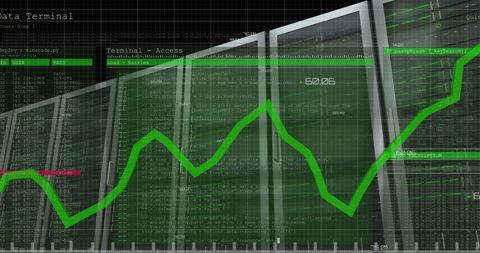
- Digital Data Analysis with Green Graph and Analytics Interface
Digital Data Analysis with Green Graph and Analytics Interface Image
Innovative visual representation of digital data analysis. Green graph line shown against a futuristic data processing interface with charts and monitoring elements. Ideal for illustrating concepts in financial analytics, technology operations, and predictive data forecasts. Useful for presentations, reports, or educational materials focused on global business and digital transformation.

downloads
Tags:
More
Credit Photo
If you would like to credit the Photo, here are some ways you can do so
Text Link
photo Link
<span class="text-link">
<span>
<a target="_blank" href=https://pikwizard.com/photo/digital-data-analysis-with-green-graph-and-analytics-interface/ac1b56f71088ccdeddcef445af292e5f/>PikWizard</a>
</span>
</span>
<span class="image-link">
<span
style="margin: 0 0 20px 0; display: inline-block; vertical-align: middle; width: 100%;"
>
<a
target="_blank"
href="https://pikwizard.com/photo/digital-data-analysis-with-green-graph-and-analytics-interface/ac1b56f71088ccdeddcef445af292e5f/"
style="text-decoration: none; font-size: 10px; margin: 0;"
>
<img src="https://pikwizard.com/pw/medium/ac1b56f71088ccdeddcef445af292e5f.jpg" style="margin: 0; width: 100%;" alt="" />
<p style="font-size: 12px; margin: 0;">PikWizard</p>
</a>
</span>
</span>
Free (free of charge)
Free for personal and commercial use.
Author: People Creations