- Home >
- Stock Photos >
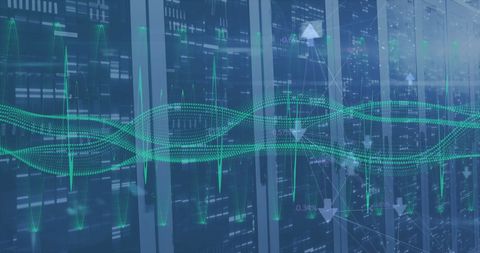
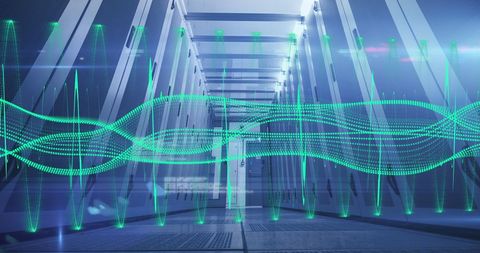
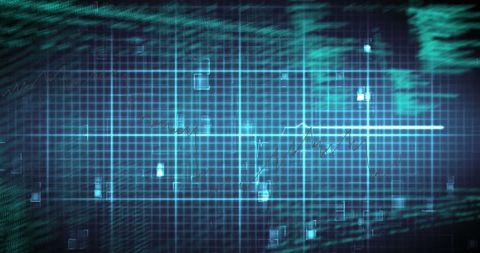
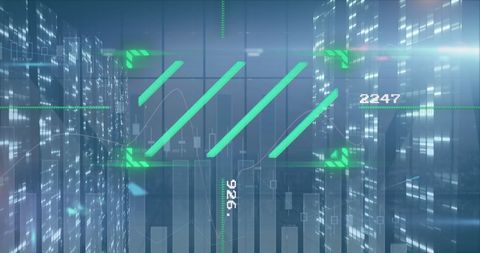
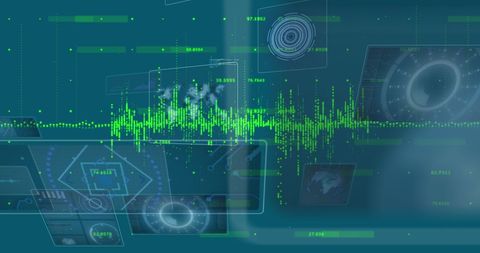
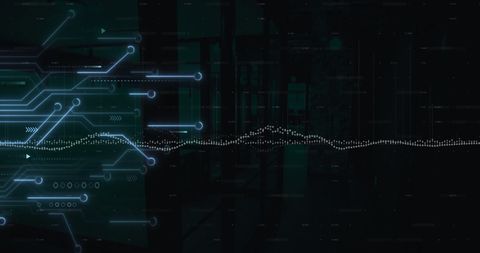
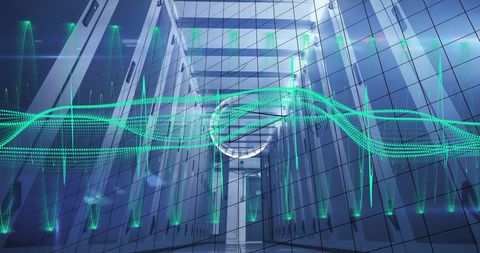
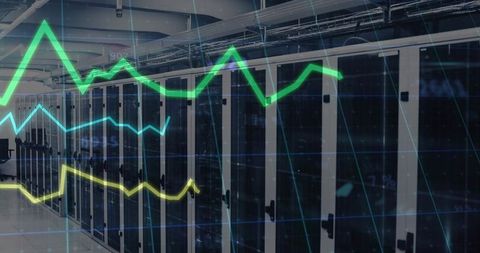
- Digital Data Analysis with Hourglass and Graph Visuals
Digital Data Analysis with Hourglass and Graph Visuals Image
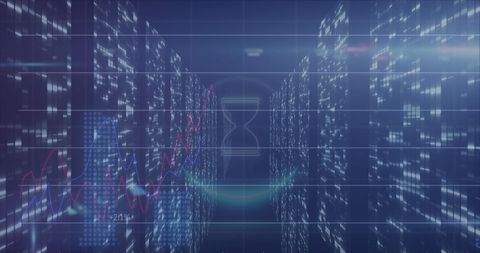
Focusing on futuristic digital display with an hourglass symbol and fluctuating graphs, symbolic of efficient data processing. Perfect for illustrating concepts in business analytics, technological advancements, and data management in promotional materials or educational presentations.

downloads
Tags:
More
Credit Photo
If you would like to credit the Photo, here are some ways you can do so
Text Link
photo Link
<span class="text-link">
<span>
<a target="_blank" href=https://pikwizard.com/photo/digital-data-analysis-with-hourglass-and-graph-visuals/09580f709311d76dbc9219f855189f47/>PikWizard</a>
</span>
</span>
<span class="image-link">
<span
style="margin: 0 0 20px 0; display: inline-block; vertical-align: middle; width: 100%;"
>
<a
target="_blank"
href="https://pikwizard.com/photo/digital-data-analysis-with-hourglass-and-graph-visuals/09580f709311d76dbc9219f855189f47/"
style="text-decoration: none; font-size: 10px; margin: 0;"
>
<img src="https://pikwizard.com/pw/medium/09580f709311d76dbc9219f855189f47.jpg" style="margin: 0; width: 100%;" alt="" />
<p style="font-size: 12px; margin: 0;">PikWizard</p>
</a>
</span>
</span>
Free (free of charge)
Free for personal and commercial use.
Author: Awesome Content