- Home >
- Stock Photos >
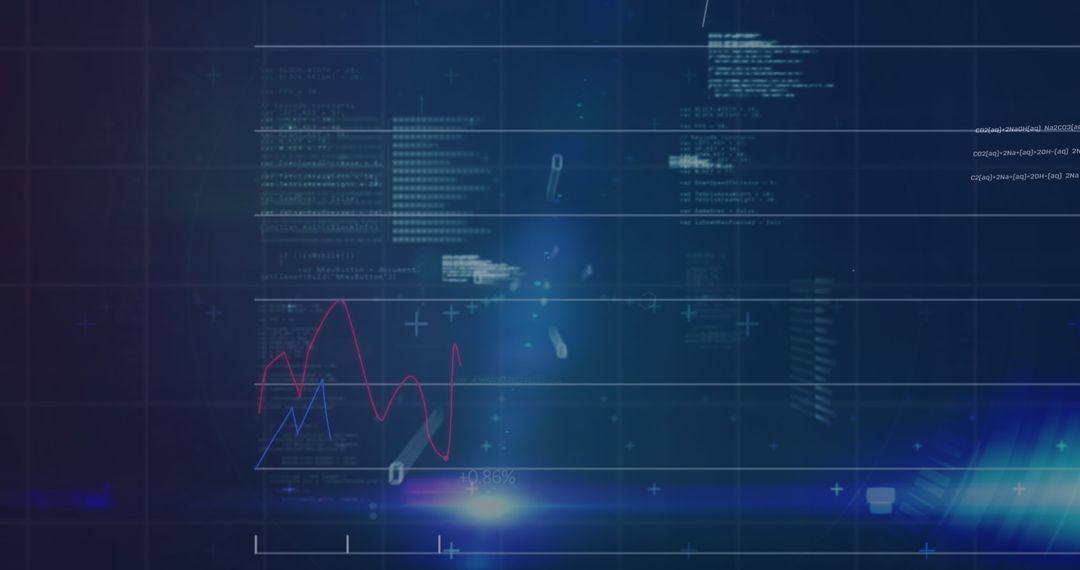
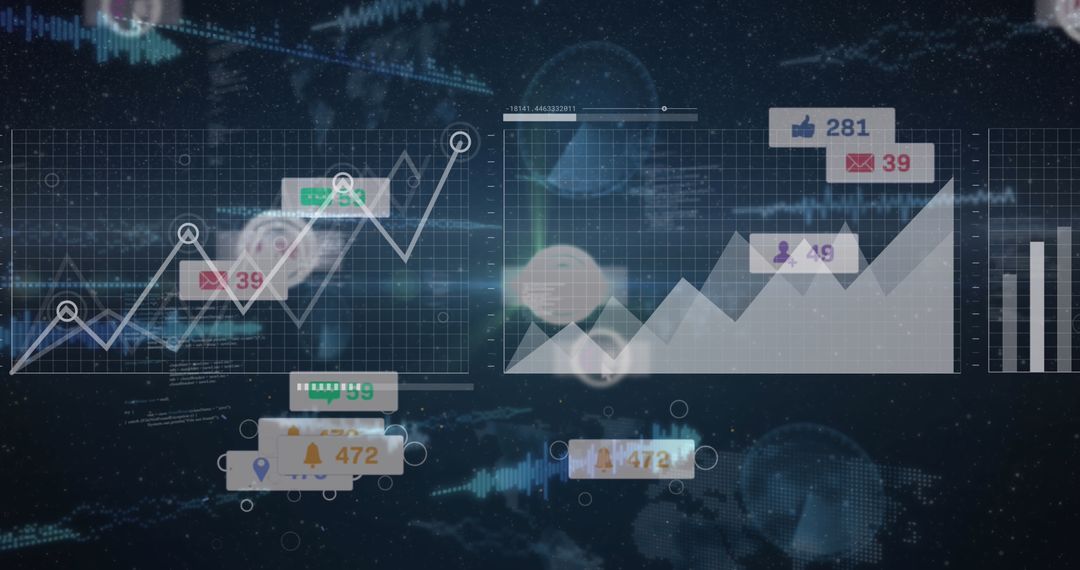
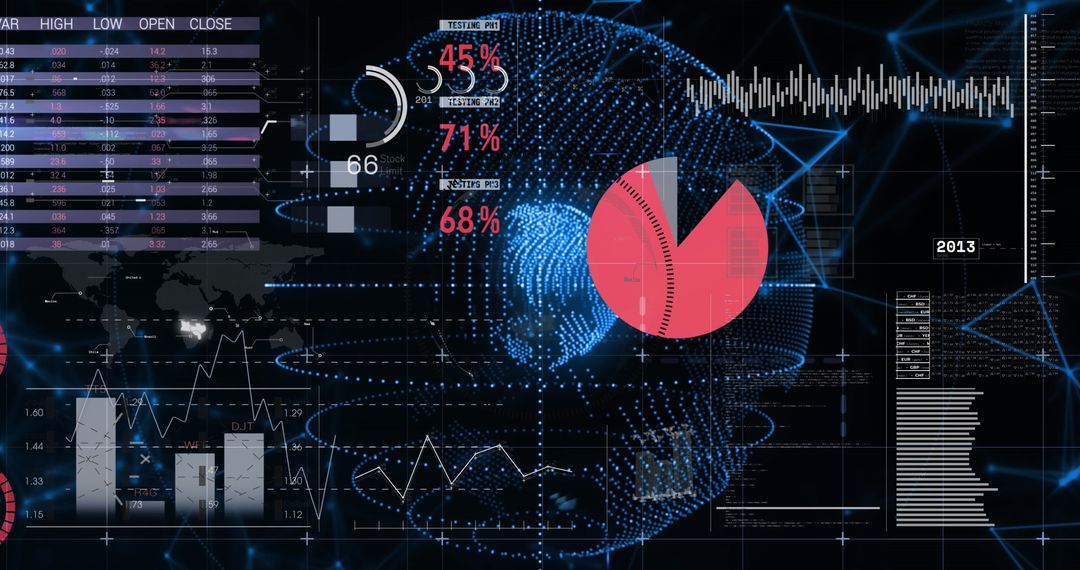
- Digital Data Analysis with Rising Trend Charts and Metrics
Digital Data Analysis with Rising Trend Charts and Metrics Image

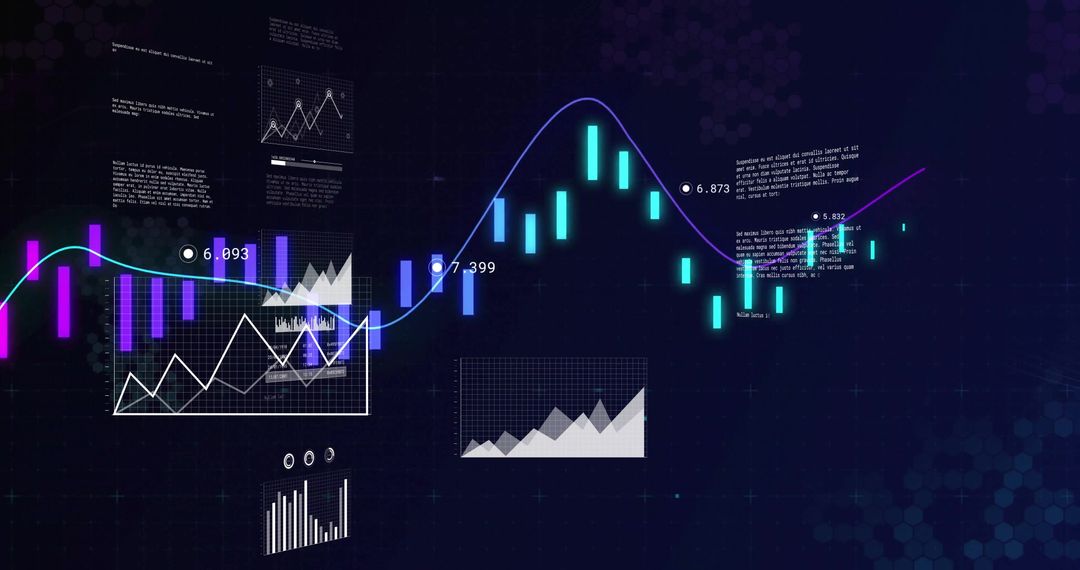
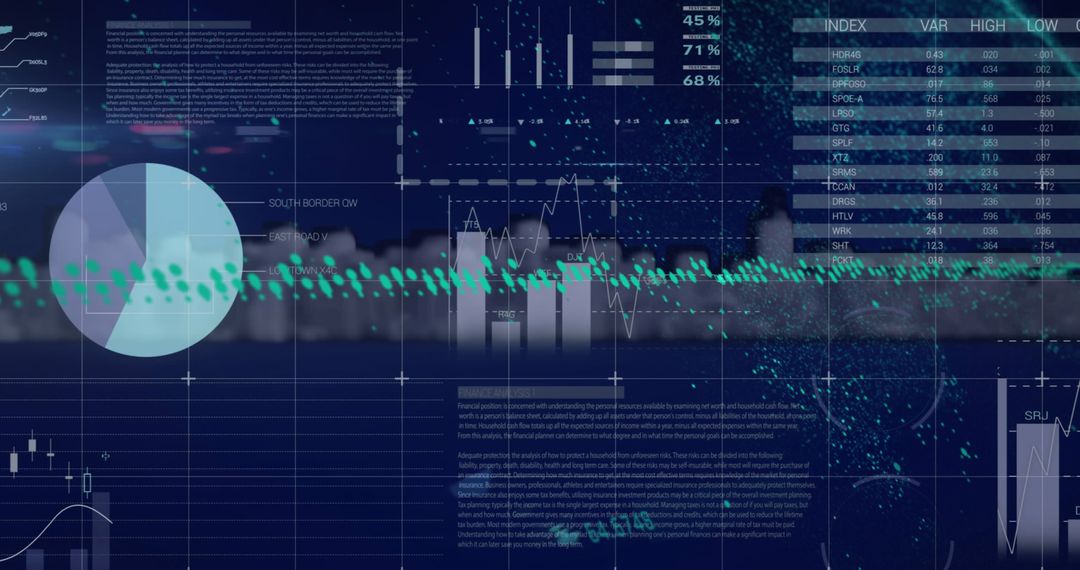
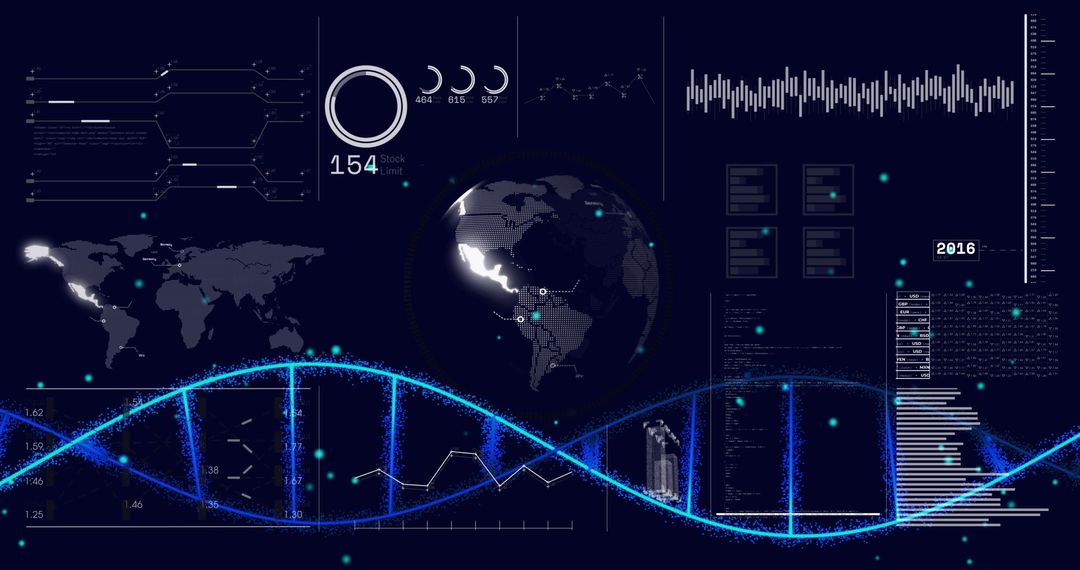
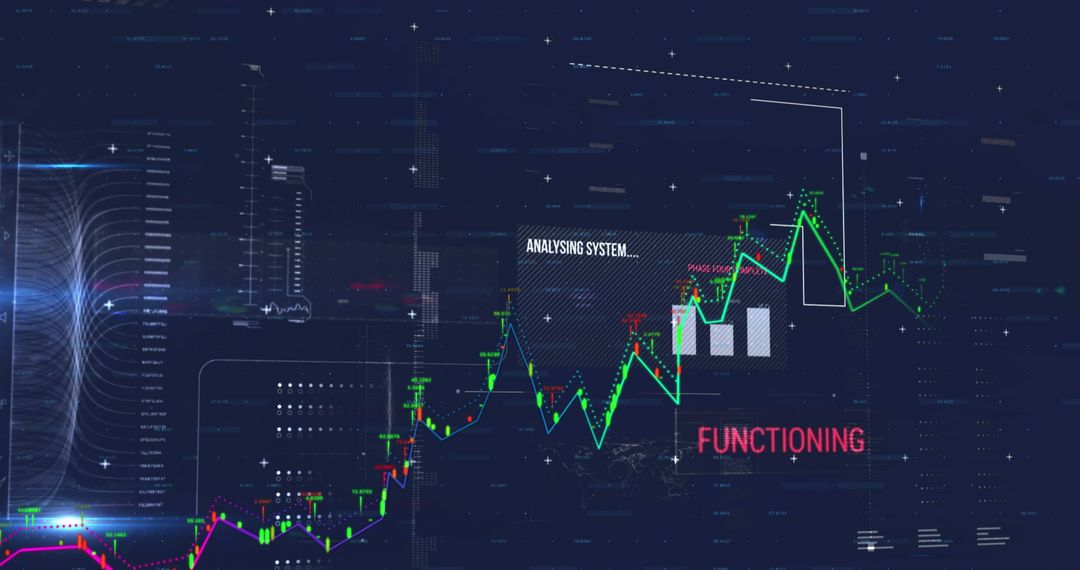
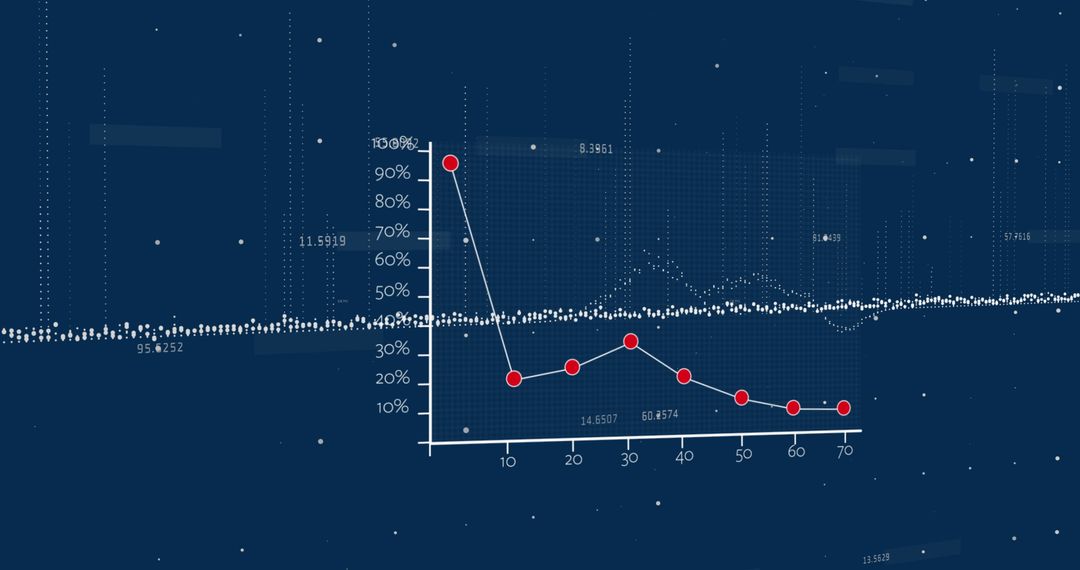
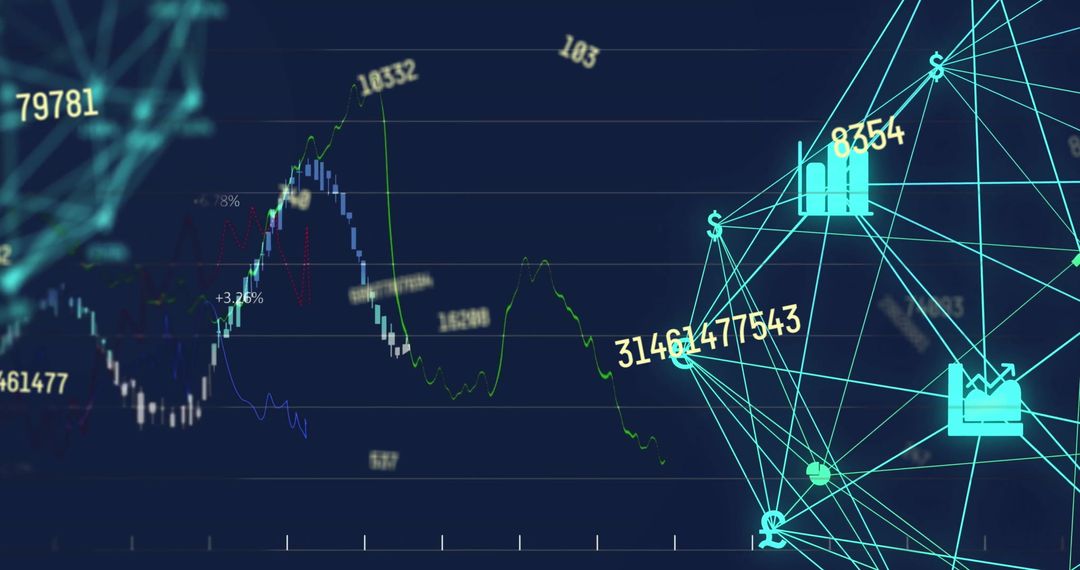
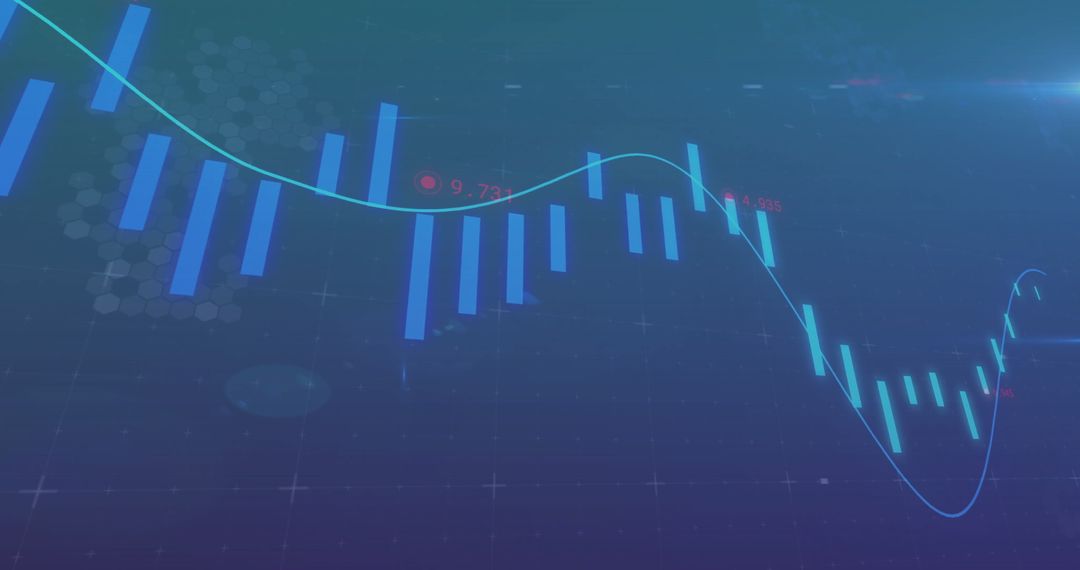
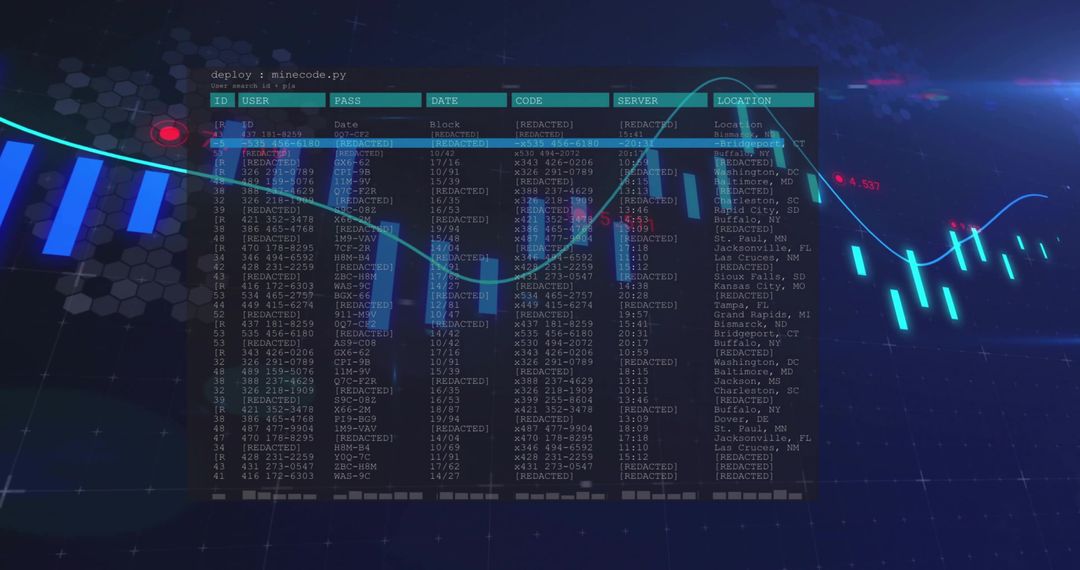
Depiction of digital data analysis with graphs, devices indicating growth and analytics. Useful for illustrating concepts in business reporting, tech publications, data science, global connectivity, and futuristic digital communication themes.
Powered by 


0
downloads
downloads
Tags:
More
Credit Photo
If you would like to credit the Photo, here are some ways you can do so
Text Link
photo Link
<span class="text-link">
<span>
<a target="_blank" href=https://pikwizard.com/photo/digital-data-analysis-with-rising-trend-charts-and-metrics/ee190fe5aa99b61ee8879b353b7df693/>PikWizard</a>
</span>
</span>
<span class="image-link">
<span
style="margin: 0 0 20px 0; display: inline-block; vertical-align: middle; width: 100%;"
>
<a
target="_blank"
href="https://pikwizard.com/photo/digital-data-analysis-with-rising-trend-charts-and-metrics/ee190fe5aa99b61ee8879b353b7df693/"
style="text-decoration: none; font-size: 10px; margin: 0;"
>
<img src="https://pikwizard.com/pw/medium/ee190fe5aa99b61ee8879b353b7df693.jpg" style="margin: 0; width: 100%;" alt="" />
<p style="font-size: 12px; margin: 0;">PikWizard</p>
</a>
</span>
</span>
Free (free of charge)
Free for personal and commercial use.
Author: People Creations
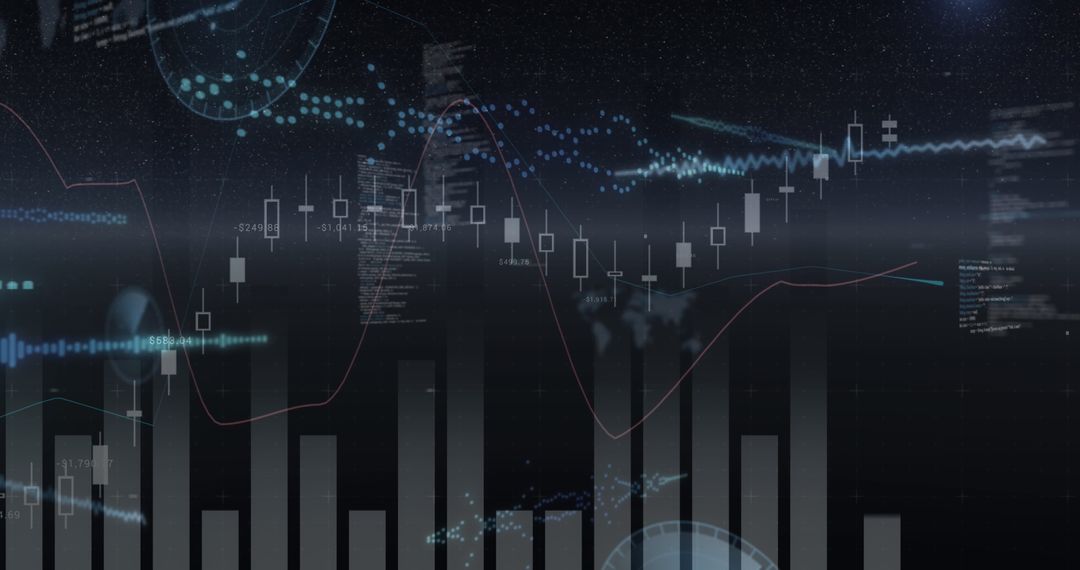
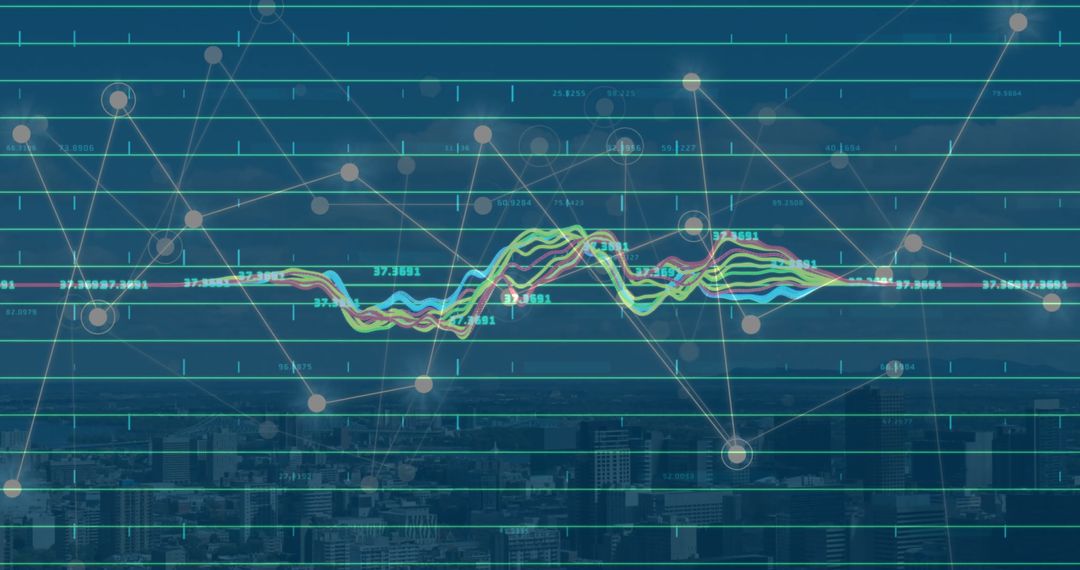
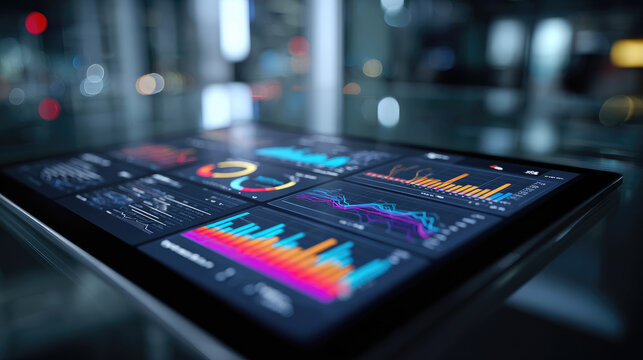
Similar Free Stock Images

Premium


Premium


Premium


Premium


Premium


Premium


Premium


Premium


Premium


Premium


Premium


Premium


Premium


Premium


Premium


Premium


Premium


Premium


Premium


Premium


Premium


Premium


Premium


Premium