- Home >
- Stock Photos >
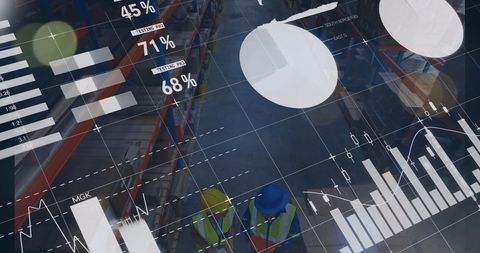
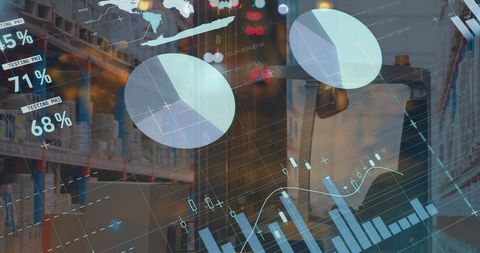
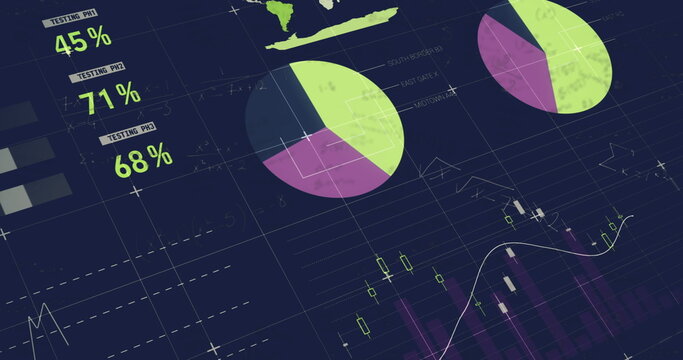
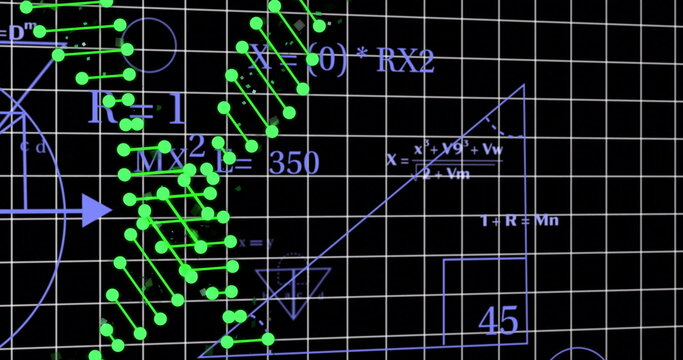
- Digital Data Analysis with Statistical Graphs and Equations
Digital Data Analysis with Statistical Graphs and Equations Image

Visual depicts intersection of technology and science featuring complex statistical data and mathematical equations overlaying a modern digital environment. Green tones add futuristic feel. Use as visualization for data-driven concepts, tech innovation, academic research, or financial projections.
Powered by 


downloads
Tags:
More
Credit Photo
If you would like to credit the Photo, here are some ways you can do so
Text Link
photo Link
<span class="text-link">
<span>
<a target="_blank" href=https://pikwizard.com/photo/digital-data-analysis-with-statistical-graphs-and-equations/8573e2652ca144f3a98ee8bae454afcb/>PikWizard</a>
</span>
</span>
<span class="image-link">
<span
style="margin: 0 0 20px 0; display: inline-block; vertical-align: middle; width: 100%;"
>
<a
target="_blank"
href="https://pikwizard.com/photo/digital-data-analysis-with-statistical-graphs-and-equations/8573e2652ca144f3a98ee8bae454afcb/"
style="text-decoration: none; font-size: 10px; margin: 0;"
>
<img src="https://pikwizard.com/pw/medium/8573e2652ca144f3a98ee8bae454afcb.jpg" style="margin: 0; width: 100%;" alt="" />
<p style="font-size: 12px; margin: 0;">PikWizard</p>
</a>
</span>
</span>
Free (free of charge)
Free for personal and commercial use.
Author: Authentic Images