- Home >
- Stock Photos >
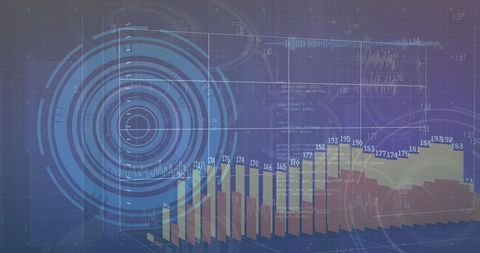
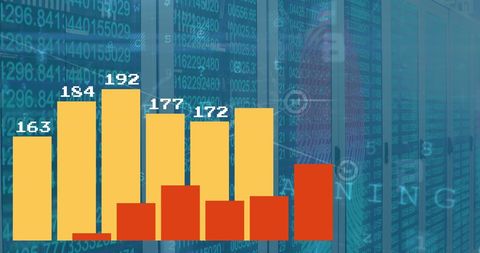
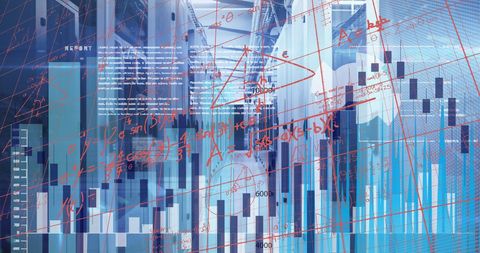
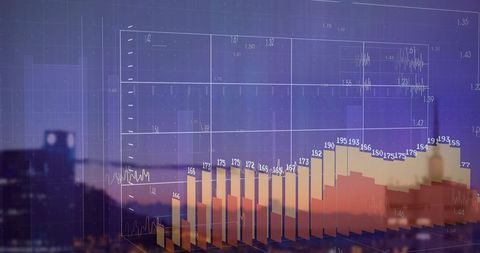
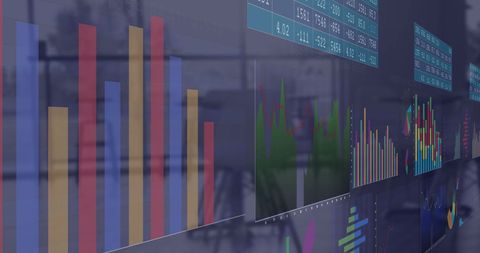
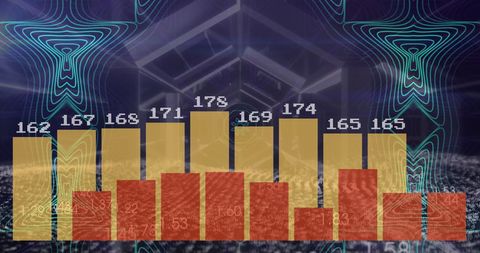
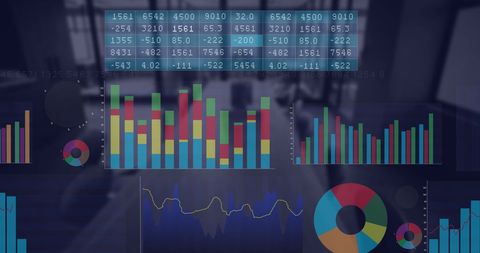
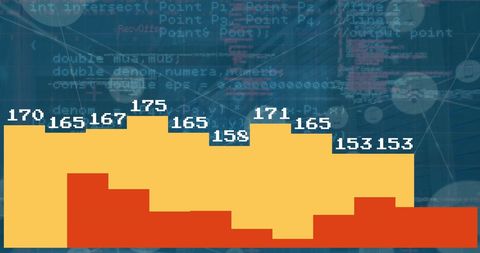
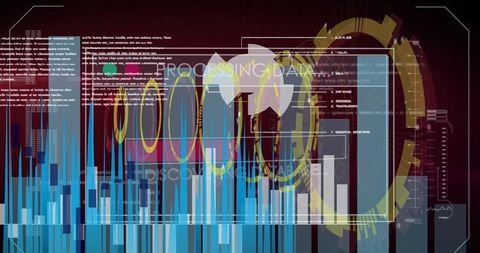
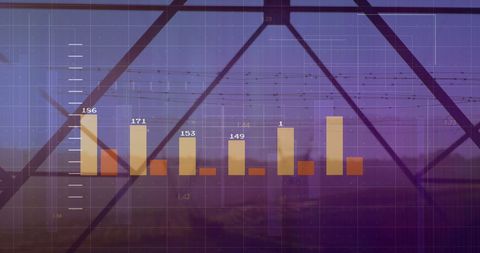
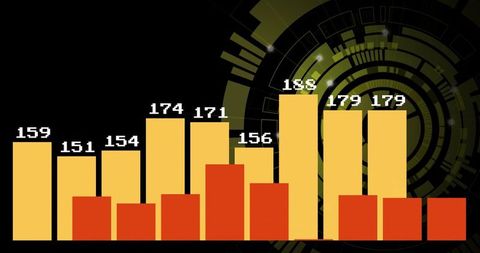
- Digital Data Analysis with Statistics Overlaid on Server Racks
Digital Data Analysis with Statistics Overlaid on Server Racks Image
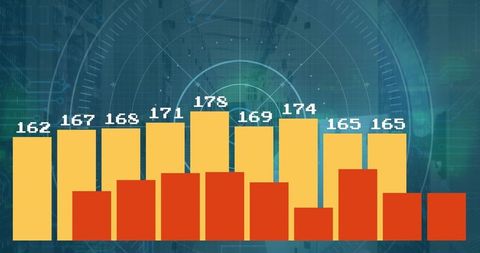
Illustrates the concept of global computing and data processing with an interactive overlay of numbers and statistics on server racks. Use for technological presentations, computing analysis infographics, and articles on information technology. Suitable for conveying themes of data management, metrics scrutiny, and digital innovation.

downloads
Tags:
More
Credit Photo
If you would like to credit the Photo, here are some ways you can do so
Text Link
photo Link
<span class="text-link">
<span>
<a target="_blank" href=https://pikwizard.com/photo/digital-data-analysis-with-statistics-overlaid-on-server-racks/0e1f13a385ec03a82ce87fa9b01de669/>PikWizard</a>
</span>
</span>
<span class="image-link">
<span
style="margin: 0 0 20px 0; display: inline-block; vertical-align: middle; width: 100%;"
>
<a
target="_blank"
href="https://pikwizard.com/photo/digital-data-analysis-with-statistics-overlaid-on-server-racks/0e1f13a385ec03a82ce87fa9b01de669/"
style="text-decoration: none; font-size: 10px; margin: 0;"
>
<img src="https://pikwizard.com/pw/medium/0e1f13a385ec03a82ce87fa9b01de669.jpg" style="margin: 0; width: 100%;" alt="" />
<p style="font-size: 12px; margin: 0;">PikWizard</p>
</a>
</span>
</span>
Free (free of charge)
Free for personal and commercial use.
Author: Creative Art