
- Home >
- Stock Photos >
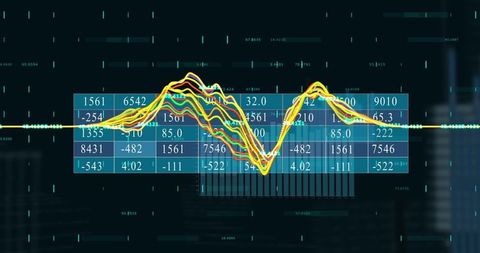
- Digital Data Analysis with Stock Market Visualization
Digital Data Analysis with Stock Market Visualization Image

Visual representation of data analysis and stock market trends using digital graphs and infographics. Ideal for use in financial technology presentations, business reports, and articles about market forecasting and global trends. Enhances understanding of complex data processing and financial insights.
Powered by  - Get 15% off with code: PIKWIZARD15


downloads
Tags:
More
Credit Photo
If you would like to credit the Photo, here are some ways you can do so
Text Link
photo Link
<span class="text-link">
<span>
<a target="_blank" href=https://pikwizard.com/photo/digital-data-analysis-with-stock-market-visualization/1c0253dc840dddb38550eb6481d4fb24/>PikWizard</a>
</span>
</span>
<span class="image-link">
<span
style="margin: 0 0 20px 0; display: inline-block; vertical-align: middle; width: 100%;"
>
<a
target="_blank"
href="https://pikwizard.com/photo/digital-data-analysis-with-stock-market-visualization/1c0253dc840dddb38550eb6481d4fb24/"
style="text-decoration: none; font-size: 10px; margin: 0;"
>
<img src="https://pikwizard.com/pw/medium/1c0253dc840dddb38550eb6481d4fb24.jpg" style="margin: 0; width: 100%;" alt="" />
<p style="font-size: 12px; margin: 0;">PikWizard</p>
</a>
</span>
</span>
Free (free of charge)
Free for personal and commercial use.
Author: Creative Art
Similar Free Stock Images

Premium


Premium

Premium


Premium


Premium

Premium


Premium


Premium

Premium

Premium

Premium


Premium


Premium


Premium


Premium

AI


Premium


Premium


Premium

Premium


Premium


Premium


Premium


Premium

Premium


Premium

Explore More Free Stock Images