
- Home >
- Stock Photos >
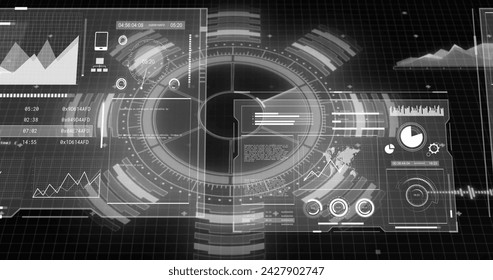
- Digital Data Analysis with Technology Interface
Digital Data Analysis with Technology Interface Image

Innovative illustration showing interplay between digital interfaces and data processing. Radar-like grid and scanning lines create a modern, futuristic atmosphere highlighting themes of technology and business analytics. Ideal for illustrating concepts related to digital data analysis, technology-driven businesses, and innovative digital solutions. Suitable for tech-focused presentations, industry reports, and educational material on data science.
Powered by  - Get 15% off with code: PIKWIZARD15


downloads
Tags:
More
Credit Photo
If you would like to credit the Photo, here are some ways you can do so
Text Link
photo Link
<span class="text-link">
<span>
<a target="_blank" href=https://pikwizard.com/photo/digital-data-analysis-with-technology-interface/9bf39f3e0a98e017c0642d5e1527aced/>PikWizard</a>
</span>
</span>
<span class="image-link">
<span
style="margin: 0 0 20px 0; display: inline-block; vertical-align: middle; width: 100%;"
>
<a
target="_blank"
href="https://pikwizard.com/photo/digital-data-analysis-with-technology-interface/9bf39f3e0a98e017c0642d5e1527aced/"
style="text-decoration: none; font-size: 10px; margin: 0;"
>
<img src="https://pikwizard.com/pw/medium/9bf39f3e0a98e017c0642d5e1527aced.jpg" style="margin: 0; width: 100%;" alt="" />
<p style="font-size: 12px; margin: 0;">PikWizard</p>
</a>
</span>
</span>
Free (free of charge)
Free for personal and commercial use.
Author: People Creations
Similar Free Stock Images

Premium


Premium


Premium


Premium


Premium


Premium


Premium


Premium


Premium


Premium


Premium


Premium


Premium


Premium


Premium


Premium


Premium


Premium


Premium


Premium

Premium


Premium


Premium


Premium
Premium

Explore More Free Stock Images