
- Home >
- Stock Photos >
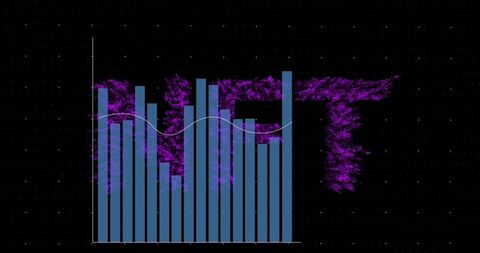
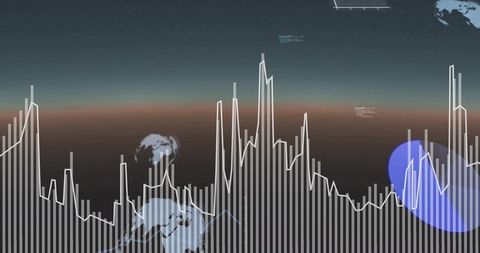
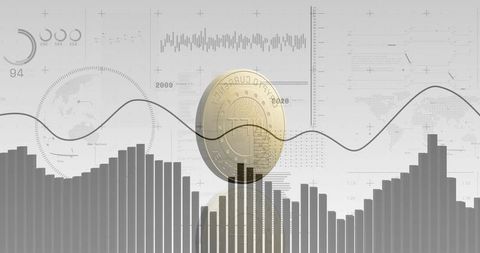
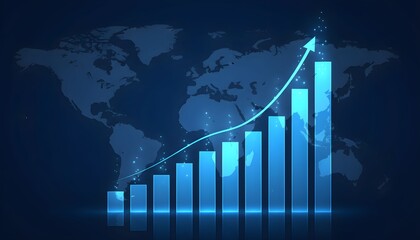
- Digital Data Analysis with World Map and Bar Graphs
Digital Data Analysis with World Map and Bar Graphs Image

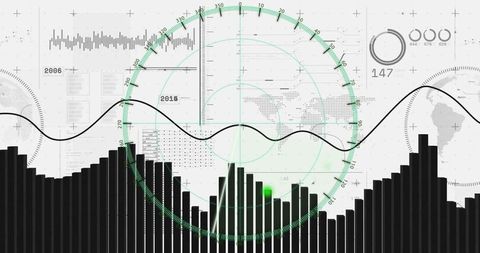
This visualization combines a global map with dynamic bar and line graphs, representing concepts of business analytics, data processing, and financial statistics. Ideal for illustrating articles, reports, or presentations focused on global economy, market trends, and data management technology. Use it for digital marketing materials or web projects emphasizing analytics capabilities.
Powered by 


downloads
Tags:
More
Credit Photo
If you would like to credit the Photo, here are some ways you can do so
Text Link
photo Link
<span class="text-link">
<span>
<a target="_blank" href=https://pikwizard.com/photo/digital-data-analysis-with-world-map-and-bar-graphs/0b5ab66d39b1e6f4976efb6160e49097/>PikWizard</a>
</span>
</span>
<span class="image-link">
<span
style="margin: 0 0 20px 0; display: inline-block; vertical-align: middle; width: 100%;"
>
<a
target="_blank"
href="https://pikwizard.com/photo/digital-data-analysis-with-world-map-and-bar-graphs/0b5ab66d39b1e6f4976efb6160e49097/"
style="text-decoration: none; font-size: 10px; margin: 0;"
>
<img src="https://pikwizard.com/pw/medium/0b5ab66d39b1e6f4976efb6160e49097.jpg" style="margin: 0; width: 100%;" alt="" />
<p style="font-size: 12px; margin: 0;">PikWizard</p>
</a>
</span>
</span>
Free (free of charge)
Free for personal and commercial use.
Author: People Creations
Similar Free Stock Images

Premium


Premium


Premium


Premium


Premium


Premium


Premium


Premium


Premium


Premium


Premium

Premium

Premium


Premium


Premium


Premium


Premium


Premium

Premium

Premium


Premium


Premium

Premium


Premium


Premium


Explore More Free Stock Images