
- Home >
- Stock Photos >
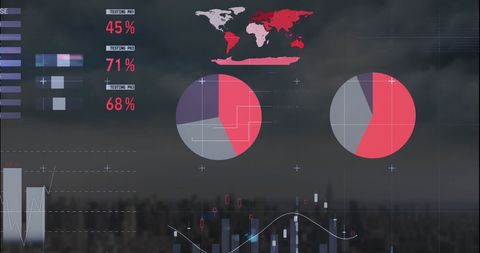
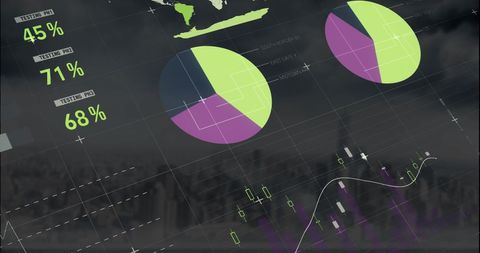
- Digital Data Analytics and Global Networking Concept
Digital Data Analytics and Global Networking Concept Image

Abstract visual of data analytics showcasing vibrant pie charts and maps over dark gradient. Suggests concept of global business, data processing, or analytics technologies. Suitable for illustrating financial reports, digital economy themes, or global networking articles.
Powered by 


downloads
Tags:
More
Credit Photo
If you would like to credit the Photo, here are some ways you can do so
Text Link
photo Link
<span class="text-link">
<span>
<a target="_blank" href=https://pikwizard.com/photo/digital-data-analytics-and-global-networking-concept/fe85892c125bd4124444e91a06b83754/>PikWizard</a>
</span>
</span>
<span class="image-link">
<span
style="margin: 0 0 20px 0; display: inline-block; vertical-align: middle; width: 100%;"
>
<a
target="_blank"
href="https://pikwizard.com/photo/digital-data-analytics-and-global-networking-concept/fe85892c125bd4124444e91a06b83754/"
style="text-decoration: none; font-size: 10px; margin: 0;"
>
<img src="https://pikwizard.com/pw/medium/fe85892c125bd4124444e91a06b83754.jpg" style="margin: 0; width: 100%;" alt="" />
<p style="font-size: 12px; margin: 0;">PikWizard</p>
</a>
</span>
</span>
Free (free of charge)
Free for personal and commercial use.
Author: People Creations
Similar Free Stock Images

Premium


Premium

Premium

Premium


Premium


Premium

Premium


Premium


Premium

Premium


Premium


Premium

Premium

Premium


Premium

Premium

Premium


Premium


Premium


Premium


Premium


Premium

Premium

Premium


Premium


Explore More Free Stock Images