- Home >
- Stock Photos >
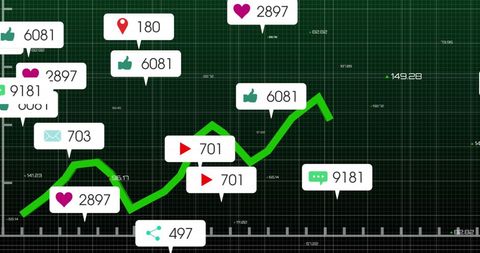
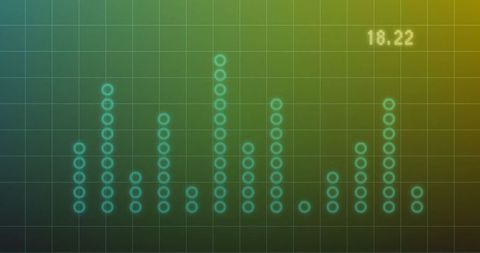
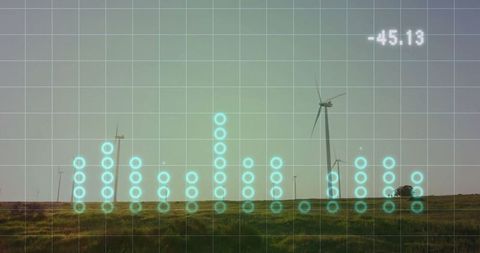
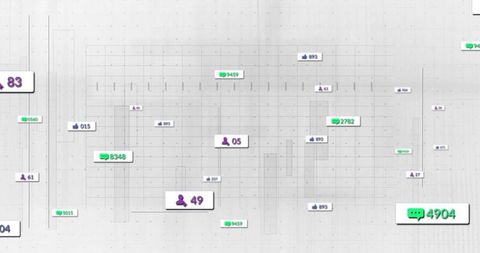
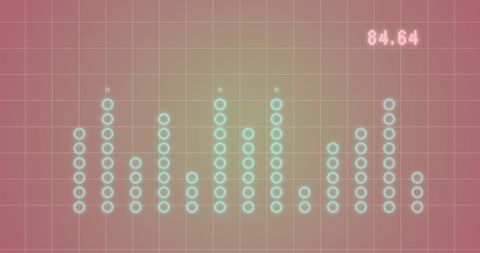
- Digital Data Analytics Chart with Icons and Labels
Digital Data Analytics Chart with Icons and Labels Image

This visualization of a digital data analytics chart combines glowing circles with thumbs-up and play icons, reflecting dynamic interaction and engagement on a digital platform. Numeric labels provide precise data insights, suitable for presentations, websites or infographics related to technology, marketing analysis, or business intelligence.

downloads
Tags:
More
Credit Photo
If you would like to credit the Photo, here are some ways you can do so
Text Link
photo Link
<span class="text-link">
<span>
<a target="_blank" href=https://pikwizard.com/photo/digital-data-analytics-chart-with-icons-and-labels/424d1a5cf1be110b81da42b427fb1e63/>PikWizard</a>
</span>
</span>
<span class="image-link">
<span
style="margin: 0 0 20px 0; display: inline-block; vertical-align: middle; width: 100%;"
>
<a
target="_blank"
href="https://pikwizard.com/photo/digital-data-analytics-chart-with-icons-and-labels/424d1a5cf1be110b81da42b427fb1e63/"
style="text-decoration: none; font-size: 10px; margin: 0;"
>
<img src="https://pikwizard.com/pw/medium/424d1a5cf1be110b81da42b427fb1e63.jpg" style="margin: 0; width: 100%;" alt="" />
<p style="font-size: 12px; margin: 0;">PikWizard</p>
</a>
</span>
</span>
Free (free of charge)
Free for personal and commercial use.
Author: Authentic Images