- Home >
- Stock Photos >
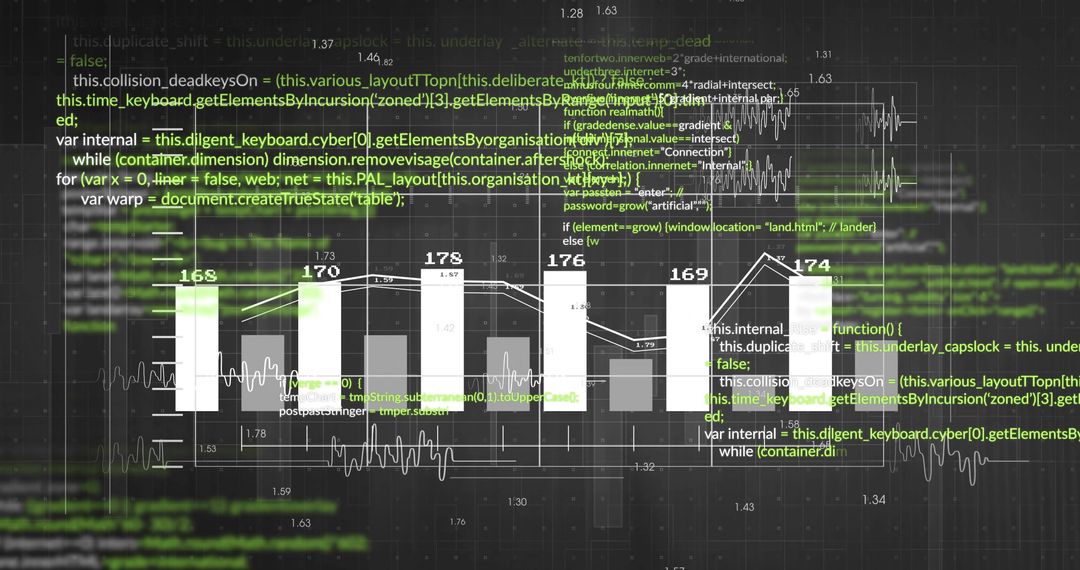
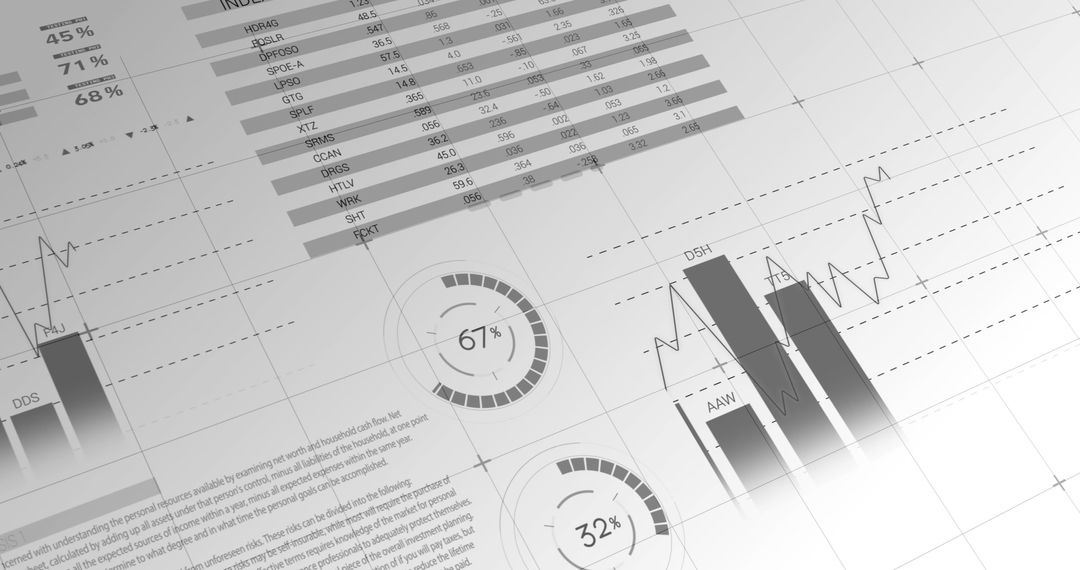
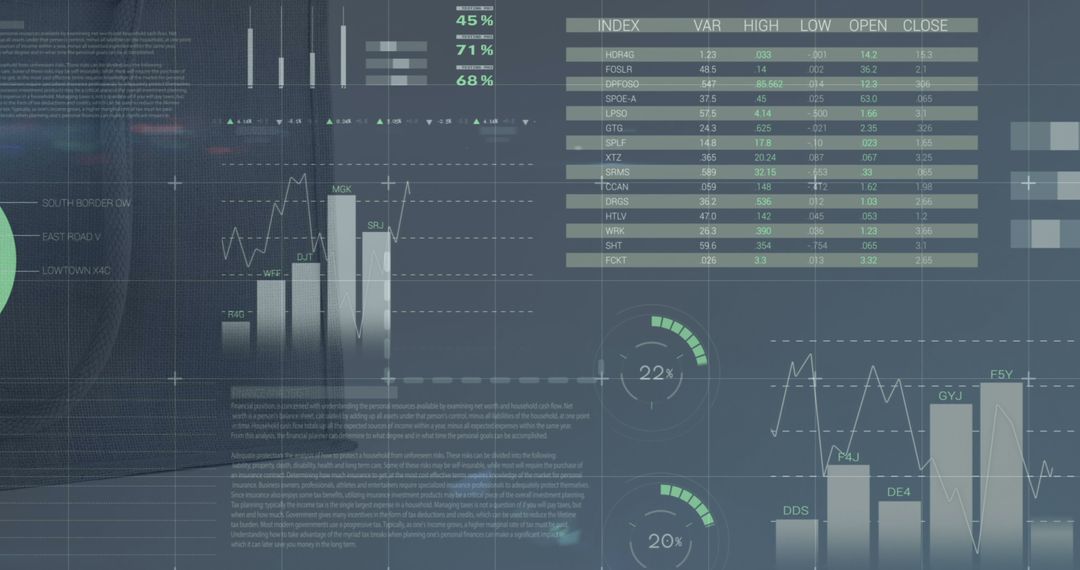
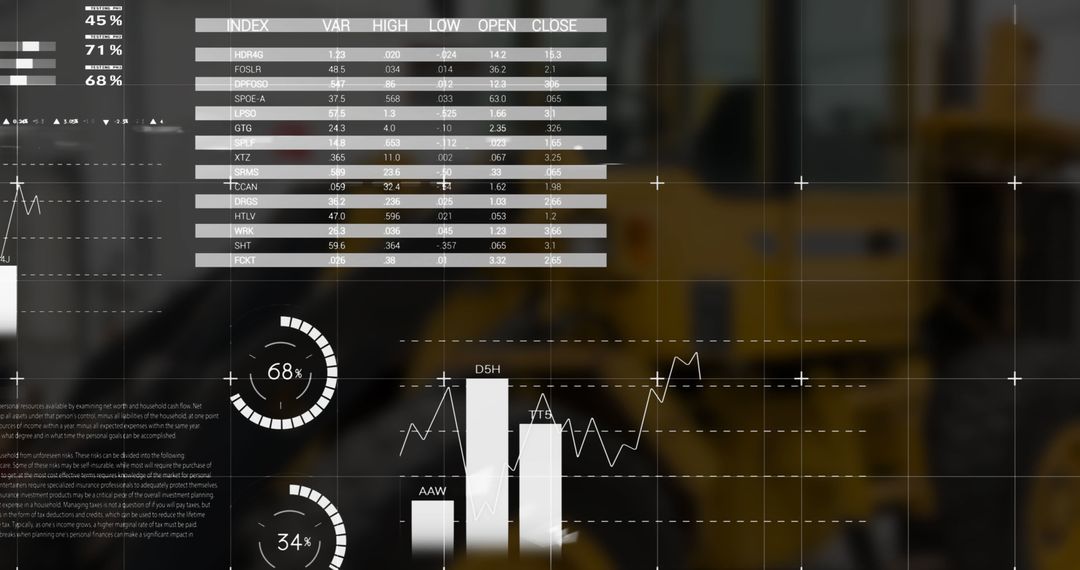
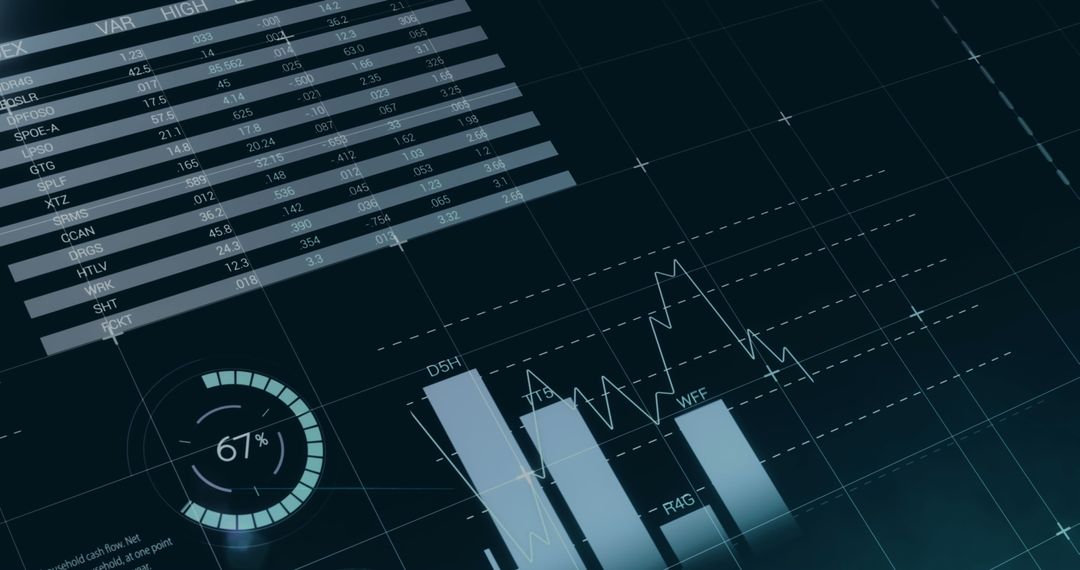
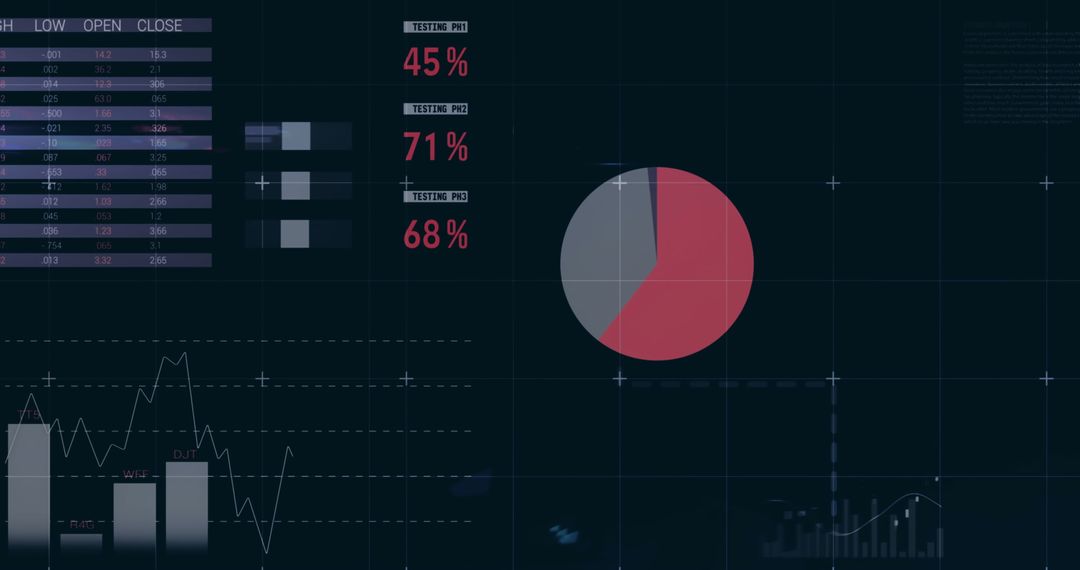
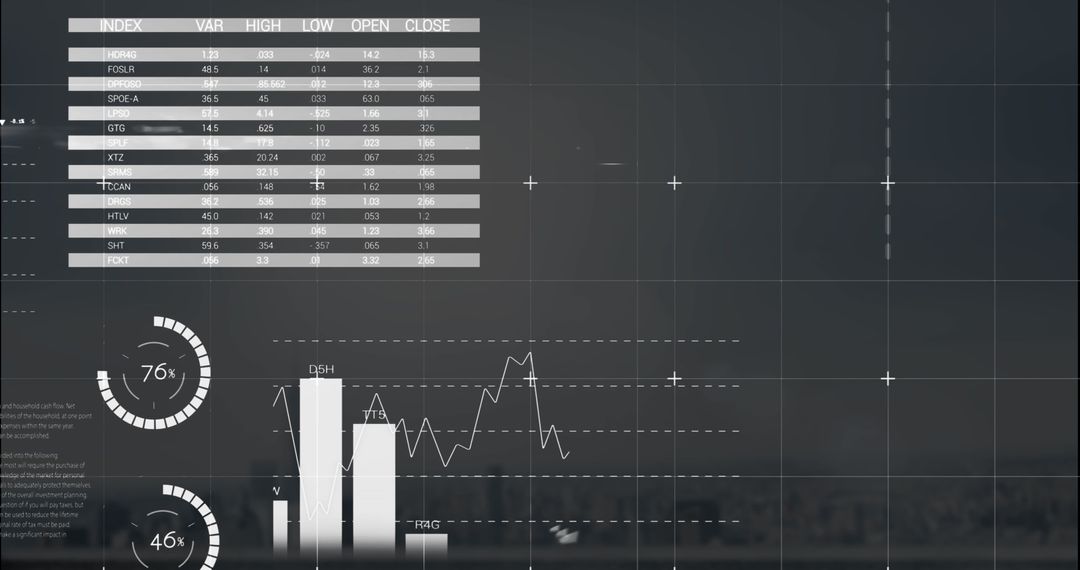
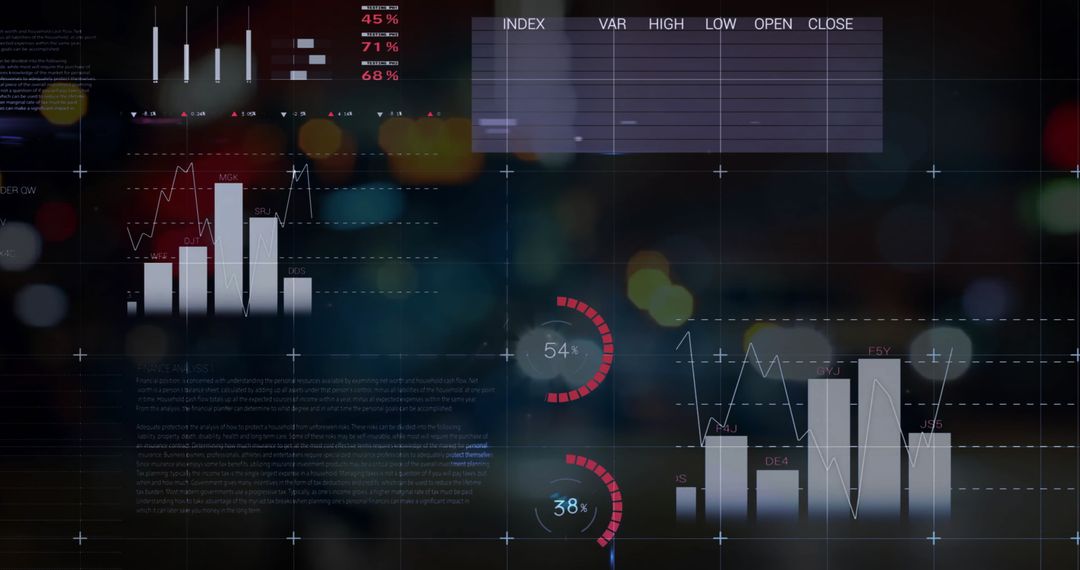
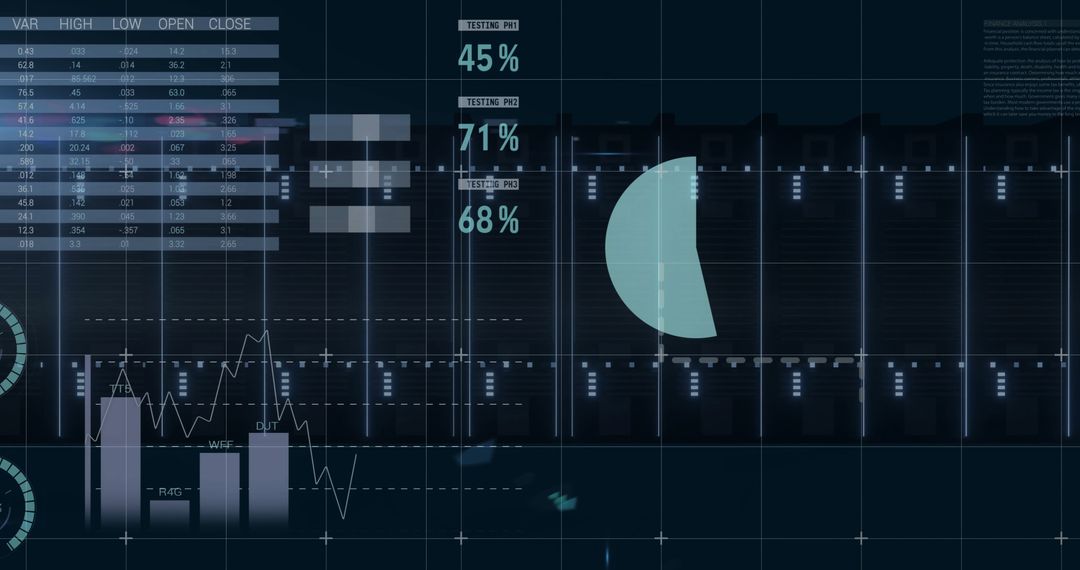
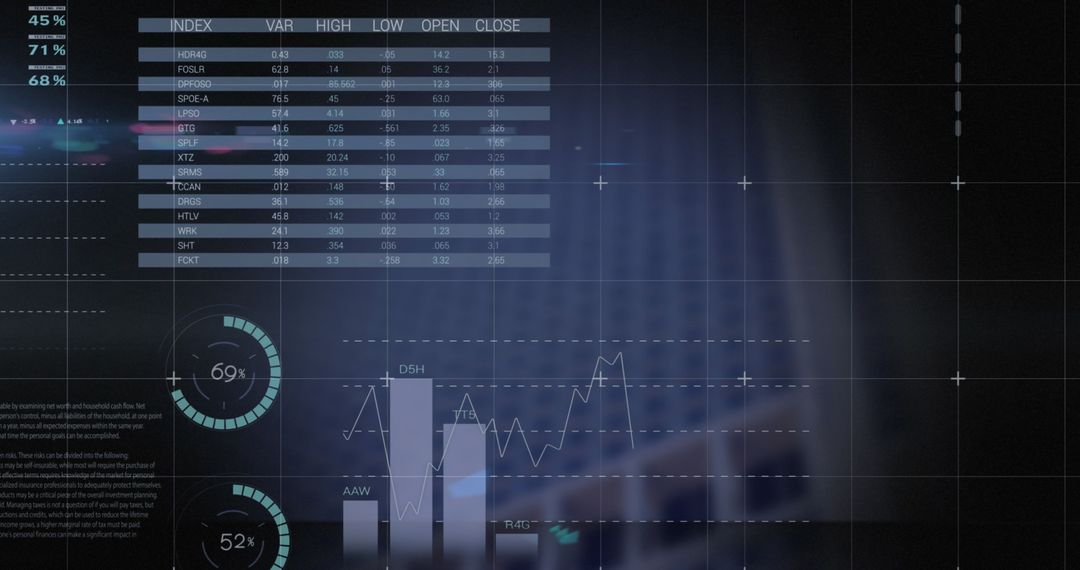
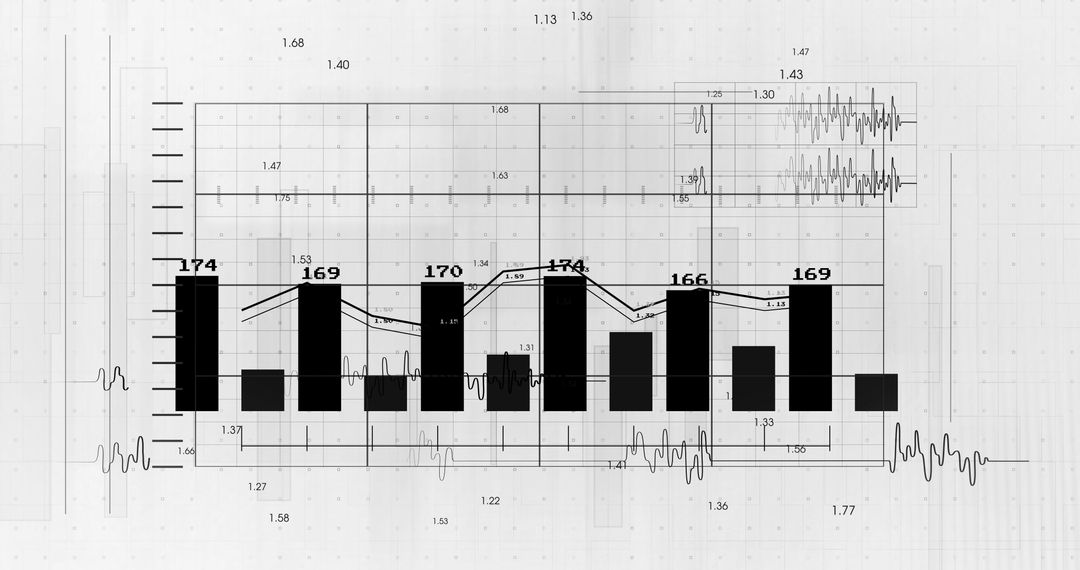
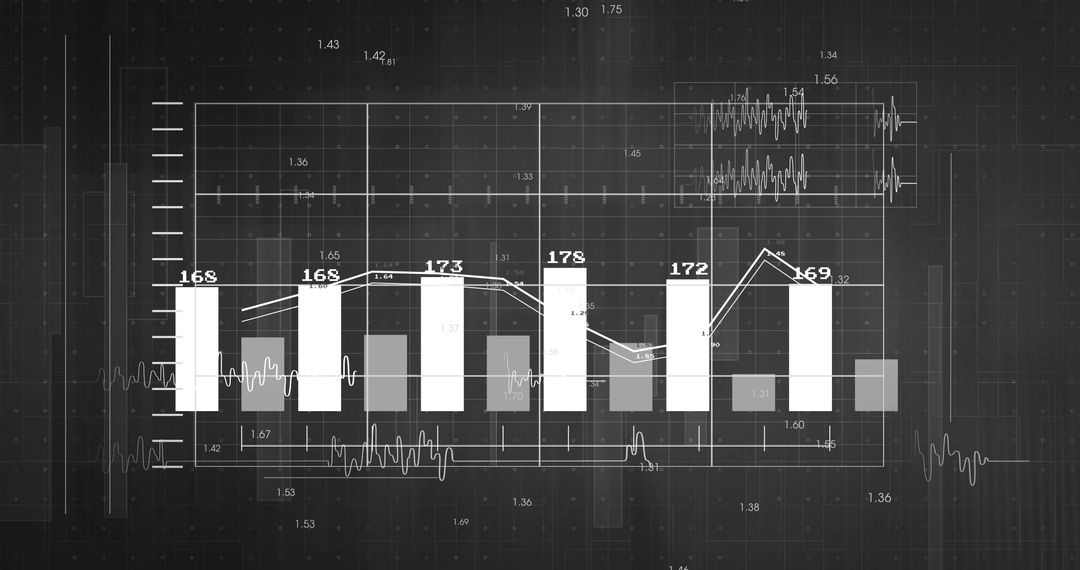
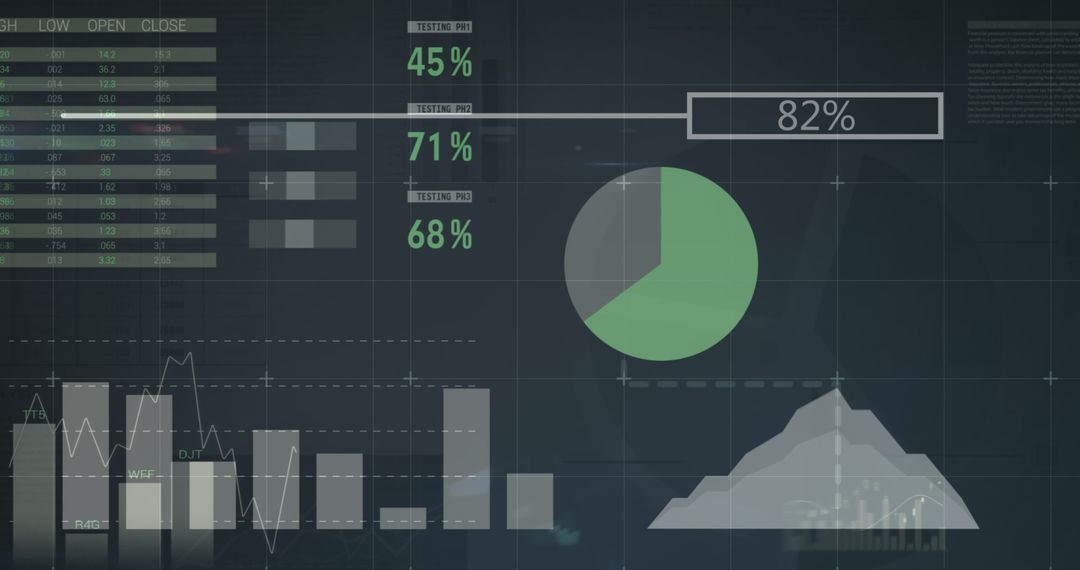
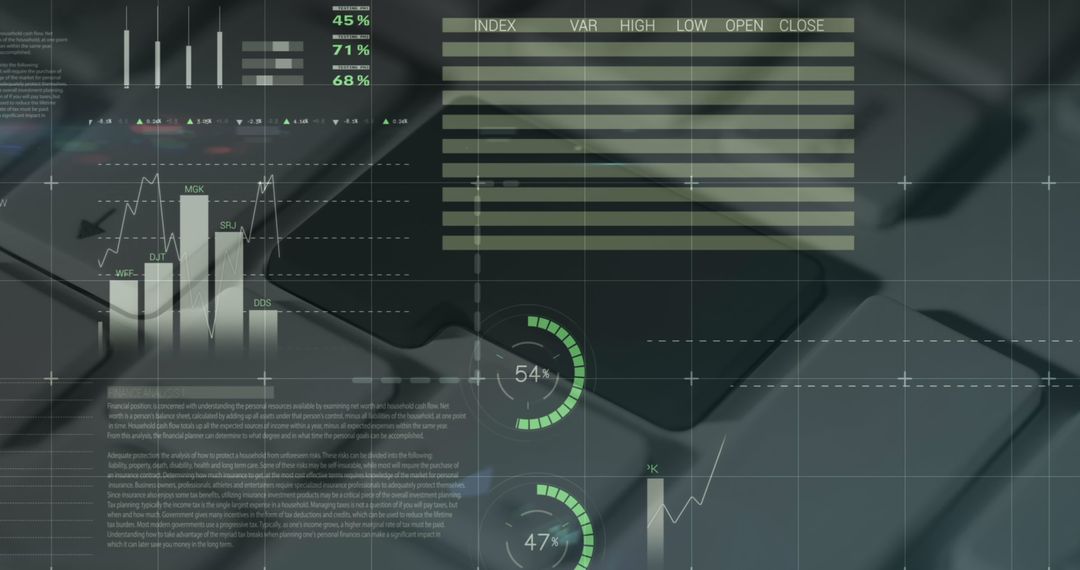
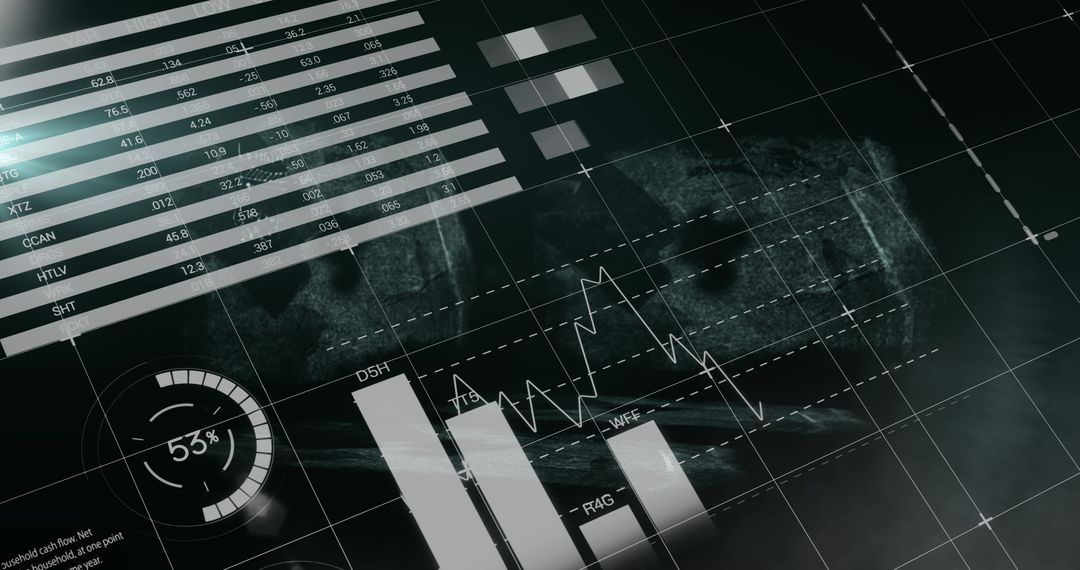
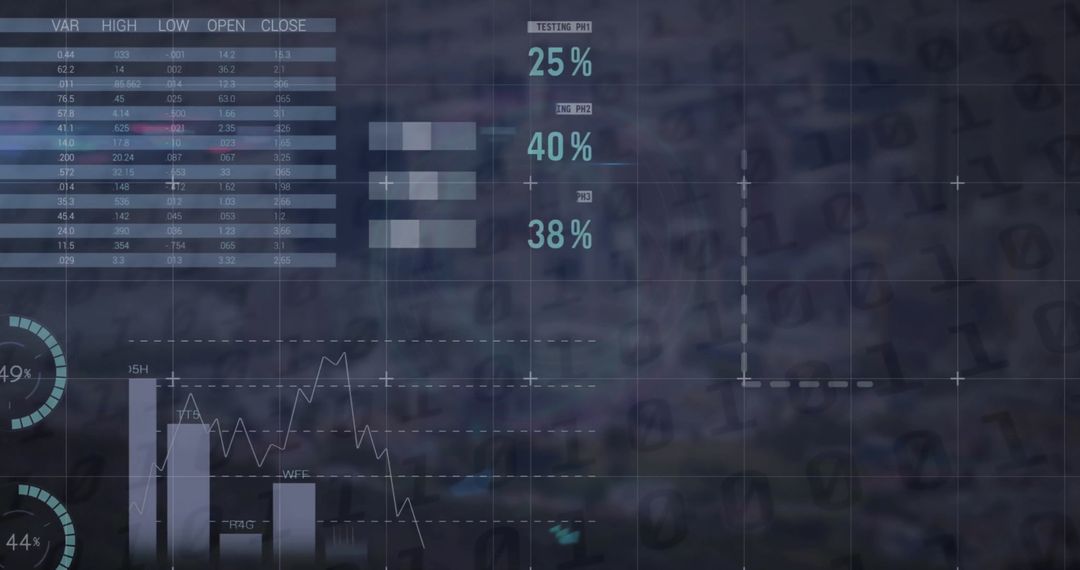
- Digital Data Analytics Dashboard Displaying Graphs and Metrics
Digital Data Analytics Dashboard Displaying Graphs and Metrics Image
This futuristic digital interface showcases assorted graphs and charts, representing real-time business data analytics. The visual layout includes bar graphs, line graphs, percentages, and key performance metrics, making it a powerful tool for professionals in fields like business, finance, and technology. It can be used by companies developing data analytics solutions or for training and presentations in business settings.
Powered by  - Get 15% off with code: PIKWIZARD15


2
downloads
downloads
Tags:
More
Credit Photo
If you would like to credit the Photo, here are some ways you can do so
Text Link
photo Link
<span class="text-link">
<span>
<a target="_blank" href=https://pikwizard.com/photo/digital-data-analytics-dashboard-displaying-graphs-and-metrics/d7245c819641675471317ab7479c85b4/>PikWizard</a>
</span>
</span>
<span class="image-link">
<span
style="margin: 0 0 20px 0; display: inline-block; vertical-align: middle; width: 100%;"
>
<a
target="_blank"
href="https://pikwizard.com/photo/digital-data-analytics-dashboard-displaying-graphs-and-metrics/d7245c819641675471317ab7479c85b4/"
style="text-decoration: none; font-size: 10px; margin: 0;"
>
<img src="https://pikwizard.com/pw/medium/d7245c819641675471317ab7479c85b4.jpg" style="margin: 0; width: 100%;" alt="" />
<p style="font-size: 12px; margin: 0;">PikWizard</p>
</a>
</span>
</span>
Free (free of charge)
Free for personal and commercial use.
Author: Creative Art
Similar Free Stock Images
Premium


Premium


Premium


Premium


Premium


Premium


Premium


Premium


Premium


Premium


Premium


Premium


Premium


Premium


Premium


Premium


Premium


Premium


Premium


Premium


Premium


Premium


Premium


Premium