
- Home >
- Stock Photos >
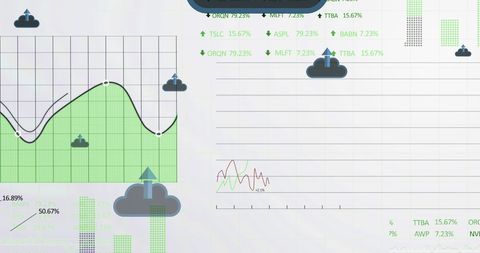
- Digital Data Analytics Dashboard with Interactive Graphs and Charts
Digital Data Analytics Dashboard with Interactive Graphs and Charts Image
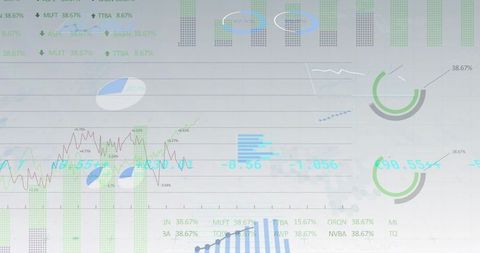
This visualization features a variety of charts including bar, line, and pie charts, ideal for illustrating complex data analytics in a business setting. Minimalistic in design, it highlights the interplay of data through interactive dashboard elements. Perfect for presentations on digital analytics, business forecasts, or educational materials focused on data visualization techniques.
Powered by 


downloads
Tags:
More
Credit Photo
If you would like to credit the Photo, here are some ways you can do so
Text Link
photo Link
<span class="text-link">
<span>
<a target="_blank" href=https://pikwizard.com/photo/digital-data-analytics-dashboard-with-interactive-graphs-and-charts/d361849fdd656a01bfcebc221953012b/>PikWizard</a>
</span>
</span>
<span class="image-link">
<span
style="margin: 0 0 20px 0; display: inline-block; vertical-align: middle; width: 100%;"
>
<a
target="_blank"
href="https://pikwizard.com/photo/digital-data-analytics-dashboard-with-interactive-graphs-and-charts/d361849fdd656a01bfcebc221953012b/"
style="text-decoration: none; font-size: 10px; margin: 0;"
>
<img src="https://pikwizard.com/pw/medium/d361849fdd656a01bfcebc221953012b.jpg" style="margin: 0; width: 100%;" alt="" />
<p style="font-size: 12px; margin: 0;">PikWizard</p>
</a>
</span>
</span>
Free (free of charge)
Free for personal and commercial use.
Author: People Creations
Similar Free Stock Images

Premium


Premium

Premium


Premium


Premium


Premium

Premium

Premium


Premium


Premium

Premium


Premium


Premium


Premium


Premium


Premium


Premium


Premium
Premium


Premium

Premium


Premium


Premium

Premium

Premium


Explore More Free Stock Images