
- Home >
- Stock Photos >
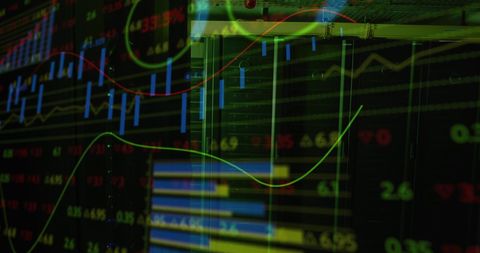
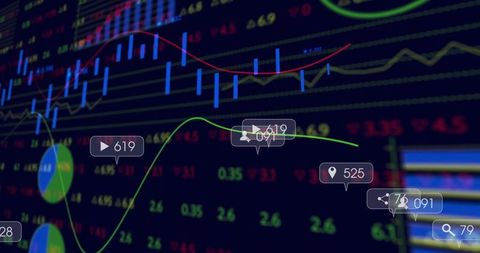
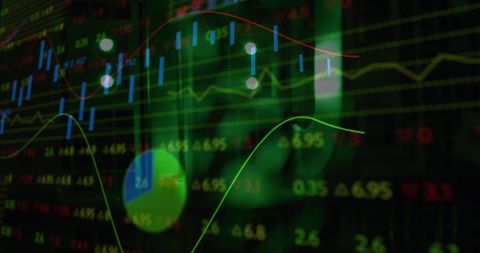
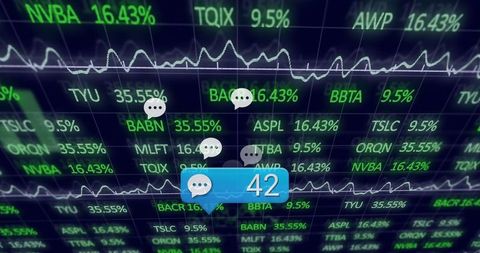
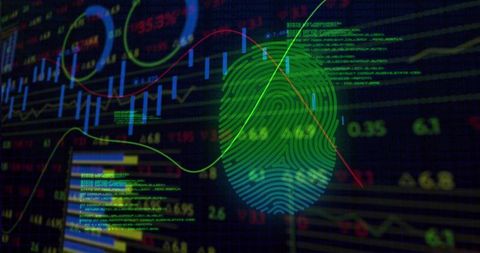
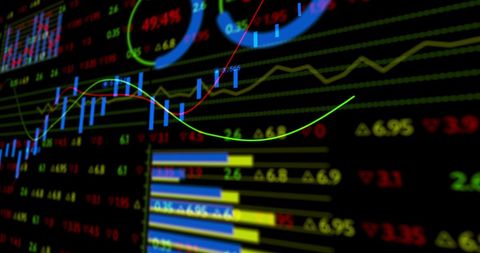
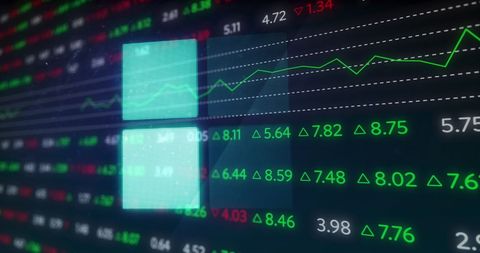
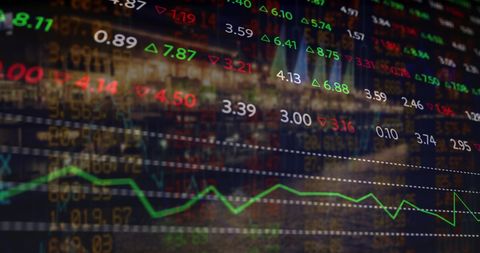
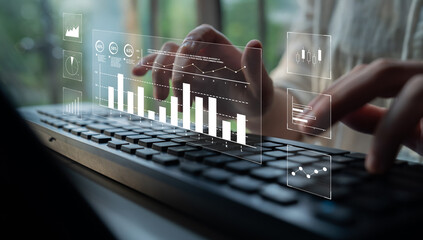
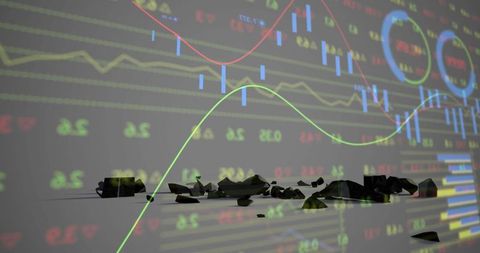
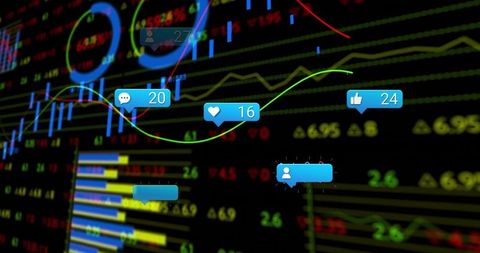
- Digital Data Analytics Dashboard with Notification and Financial Graph
Digital Data Analytics Dashboard with Notification and Financial Graph Image
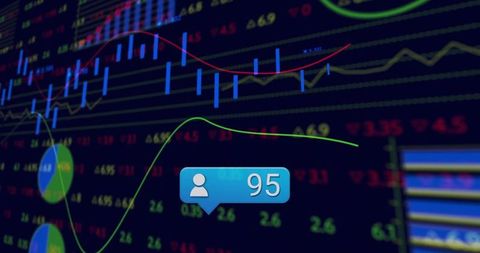
Digital interface features analytics dashboard showcasing candlestick and bar charts with a notification symbol indicating '95'. Ideal for finance, economics content, investment technology, stock trading tutorials, presentations on data-driven decision making, and digital marketing focusing on high-tech solutions.
Powered by 


downloads
Tags:
More
Credit Photo
If you would like to credit the Photo, here are some ways you can do so
Text Link
photo Link
<span class="text-link">
<span>
<a target="_blank" href=https://pikwizard.com/photo/digital-data-analytics-dashboard-with-notification-and-financial-graph/8046d44079e8ed2c135b8ef9d8d5a9ad/>PikWizard</a>
</span>
</span>
<span class="image-link">
<span
style="margin: 0 0 20px 0; display: inline-block; vertical-align: middle; width: 100%;"
>
<a
target="_blank"
href="https://pikwizard.com/photo/digital-data-analytics-dashboard-with-notification-and-financial-graph/8046d44079e8ed2c135b8ef9d8d5a9ad/"
style="text-decoration: none; font-size: 10px; margin: 0;"
>
<img src="https://pikwizard.com/pw/medium/8046d44079e8ed2c135b8ef9d8d5a9ad.jpg" style="margin: 0; width: 100%;" alt="" />
<p style="font-size: 12px; margin: 0;">PikWizard</p>
</a>
</span>
</span>
Free (free of charge)
Free for personal and commercial use.
Author: Authentic Images
Similar Free Stock Images

Premium


Premium

Premium


Premium


Premium
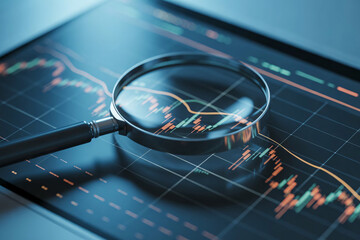
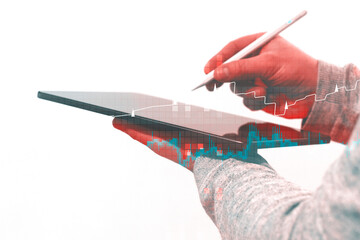
![[The tablet displaying colorful financial candlestick charts and market data in soft bokeh]](https://t4.ftcdn.net/jpg/16/69/72/09/240_F_1669720911_0WX7fuSNVdvc3W4FHVnAjOhcruAw0KWz.jpg)


Premium


Premium


Premium
Premium

Premium


Premium


Premium


Premium
Premium

Premium


Premium


Premium


Premium


Premium

Premium

Premium


Premium

Premium

Premium


Premium


Explore More Free Stock Images